Vaulta Wallet History
Designing a movement-based intelligence system for financial admins
Context
Vaulta (a fictional name used for confidentiality) is a fintech platform that enables admins to manage payouts, collections, and wallet activity for multiple merchants at scale.
This case study focuses on redesigning the Wallet History experience which transforming it from a static data table into a decision-support system that helps admins quickly understand movement, risk, and priority across merchants.
My Role
Product & System Design · UX Architecture · Data Interpretation Model · UI & Interaction Design
Platform
Web (Enterprise Admin Dashboard) Design
02 Reframing The Problem : Thinking like an Admin
Instead of starting with UI improvements, I reframed the problem from the admin’s perspective. Admins don’t manage a single merchant. They manage many similar to how a hotel headquarters oversees multiple branches under one roof.
Each merchant behaves differently: some grow steadily, some fluctuate within a normal range, and some show sudden spikes or drops. In this context, admins don’t have time to read tables or compare values row by row. They need to scan for movement.
This shift in perspective became the foundation of the redesign.
03 Designing the System, Not the Interface
At this stage, I intentionally did not move into UI exploration.The core issue wasn’t layout, typography, or table density. It was that the system itself placed too much responsibility on the admin.
In a product operating at scale, interpretation should not be
manual.
The system should:
- Detect meaningful movement
- Seperate noise from signal
- Surface deviations
- Guide attention
- Reduce congnitive effort
So before designing screens, I focused on “defining how the system should think.” This reframed the challenge from UI design to financial intelligence design.
04 Shifting Responsibility from User to System
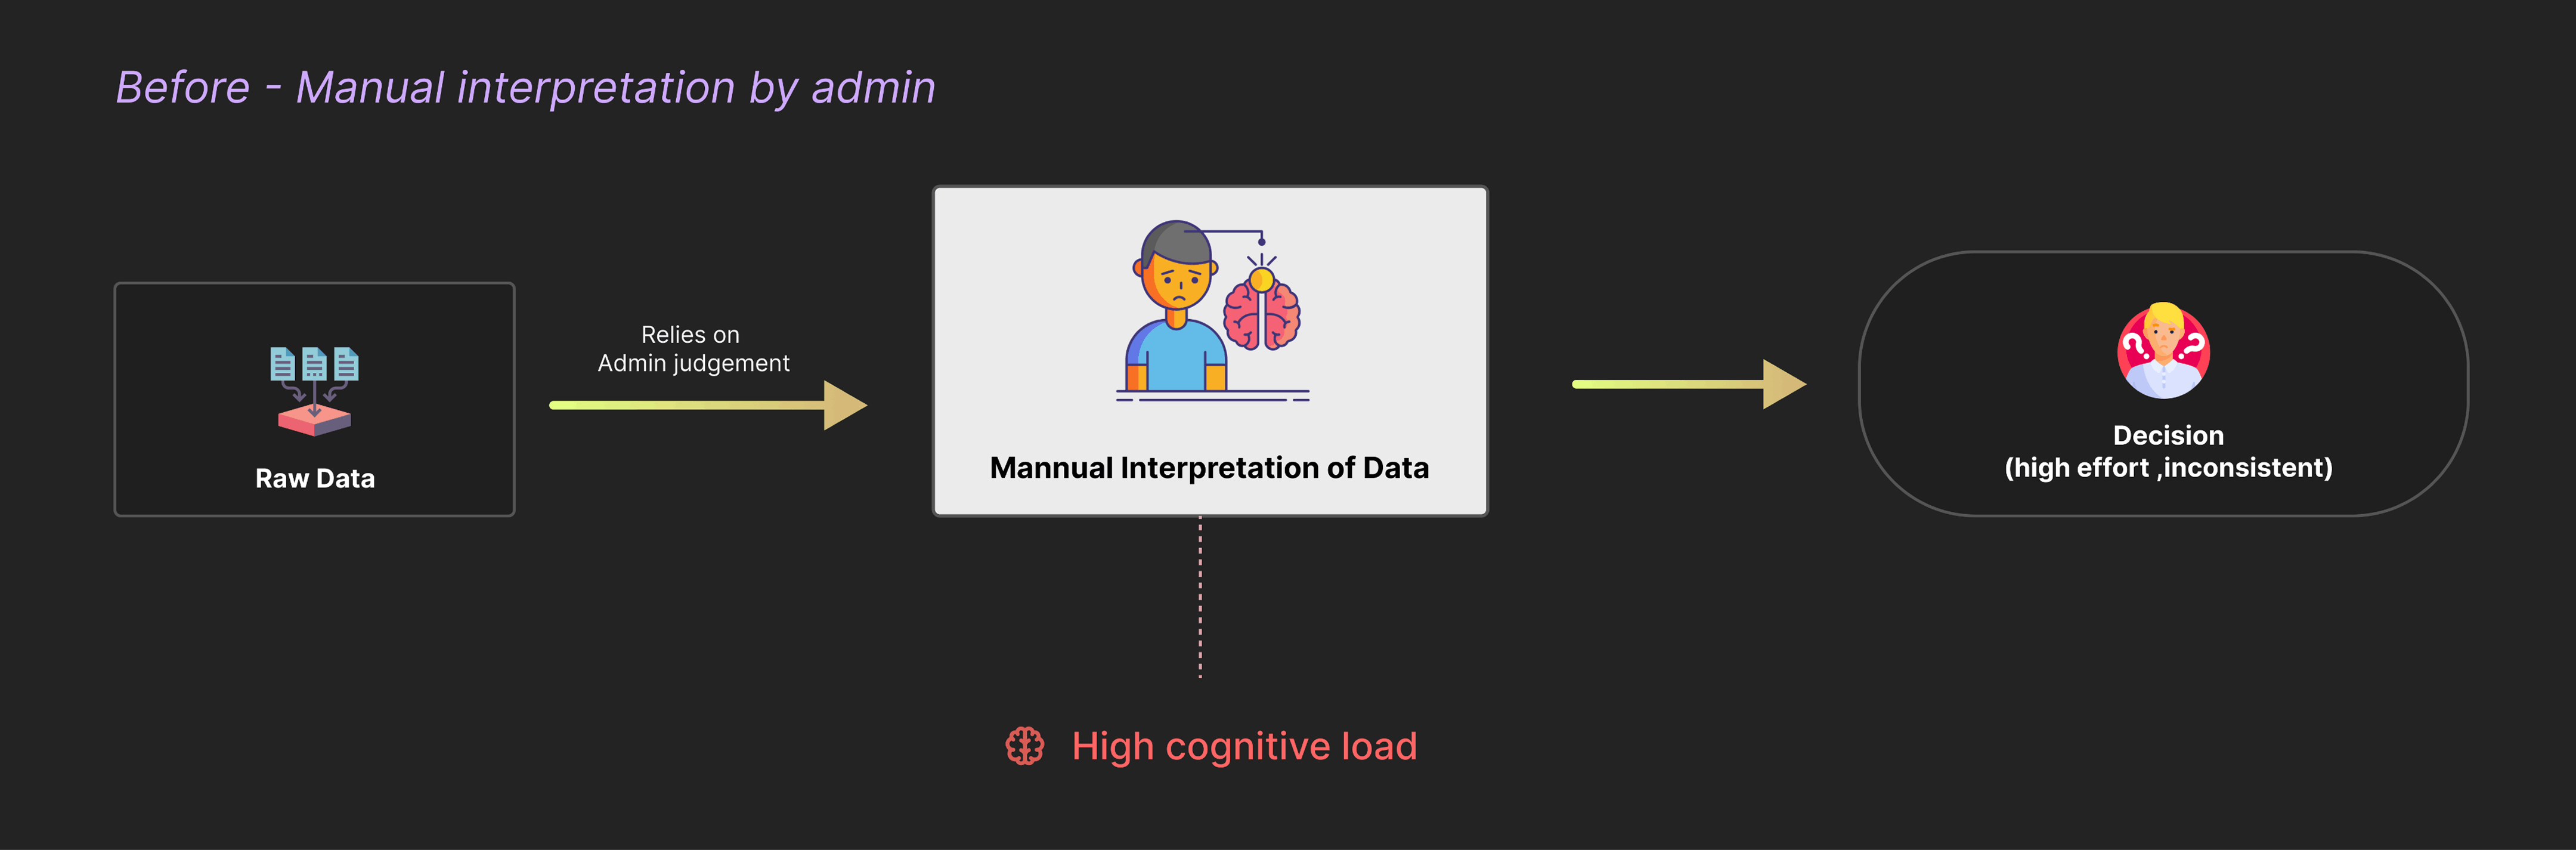
Previously, interpretation lived entirely with the admin.
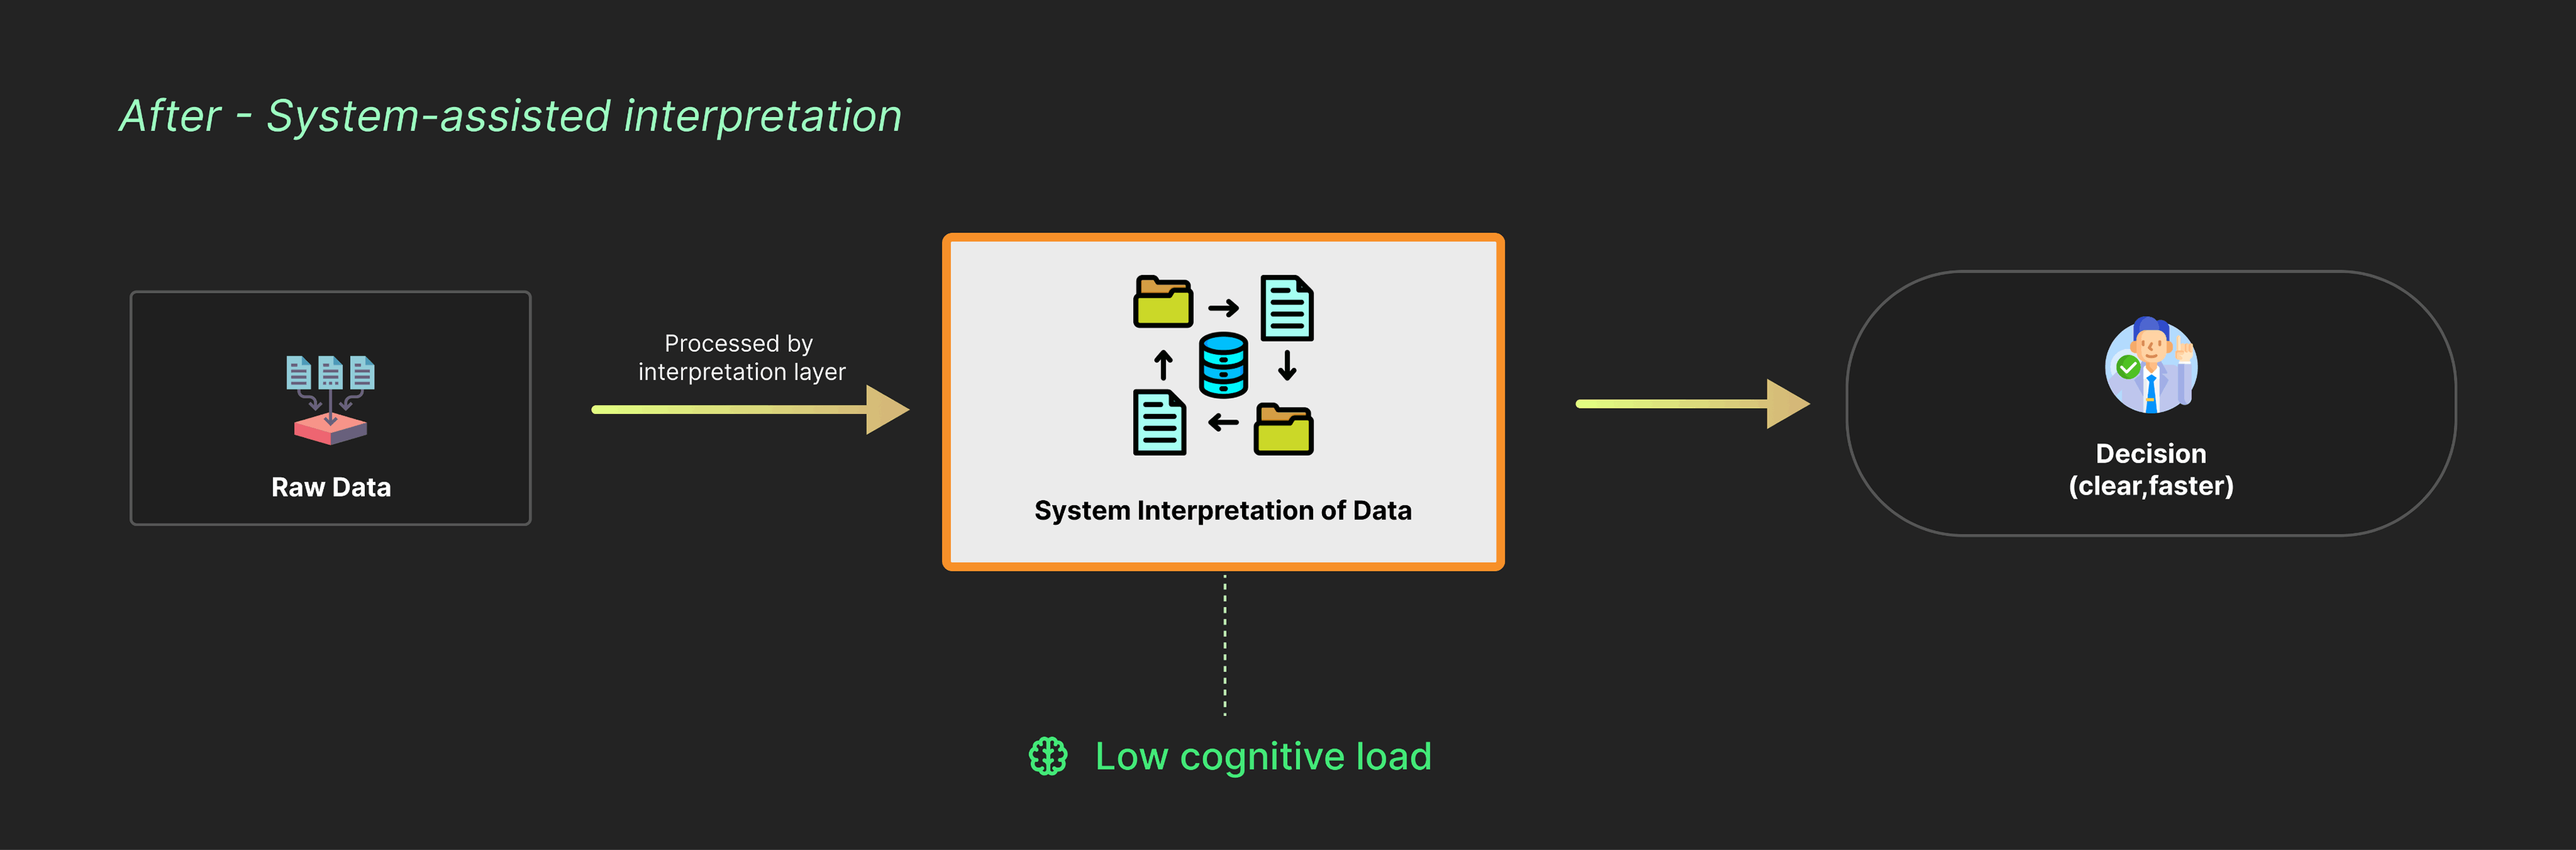
Now, This redesign moves interpretation into the system, reducing cognitive load and enabling faster, more confident decisions.
05 Designing an Interpretation Layer
Rather than exposing raw transactions and balances, I designed an interpretation layer that sits between data and interface.
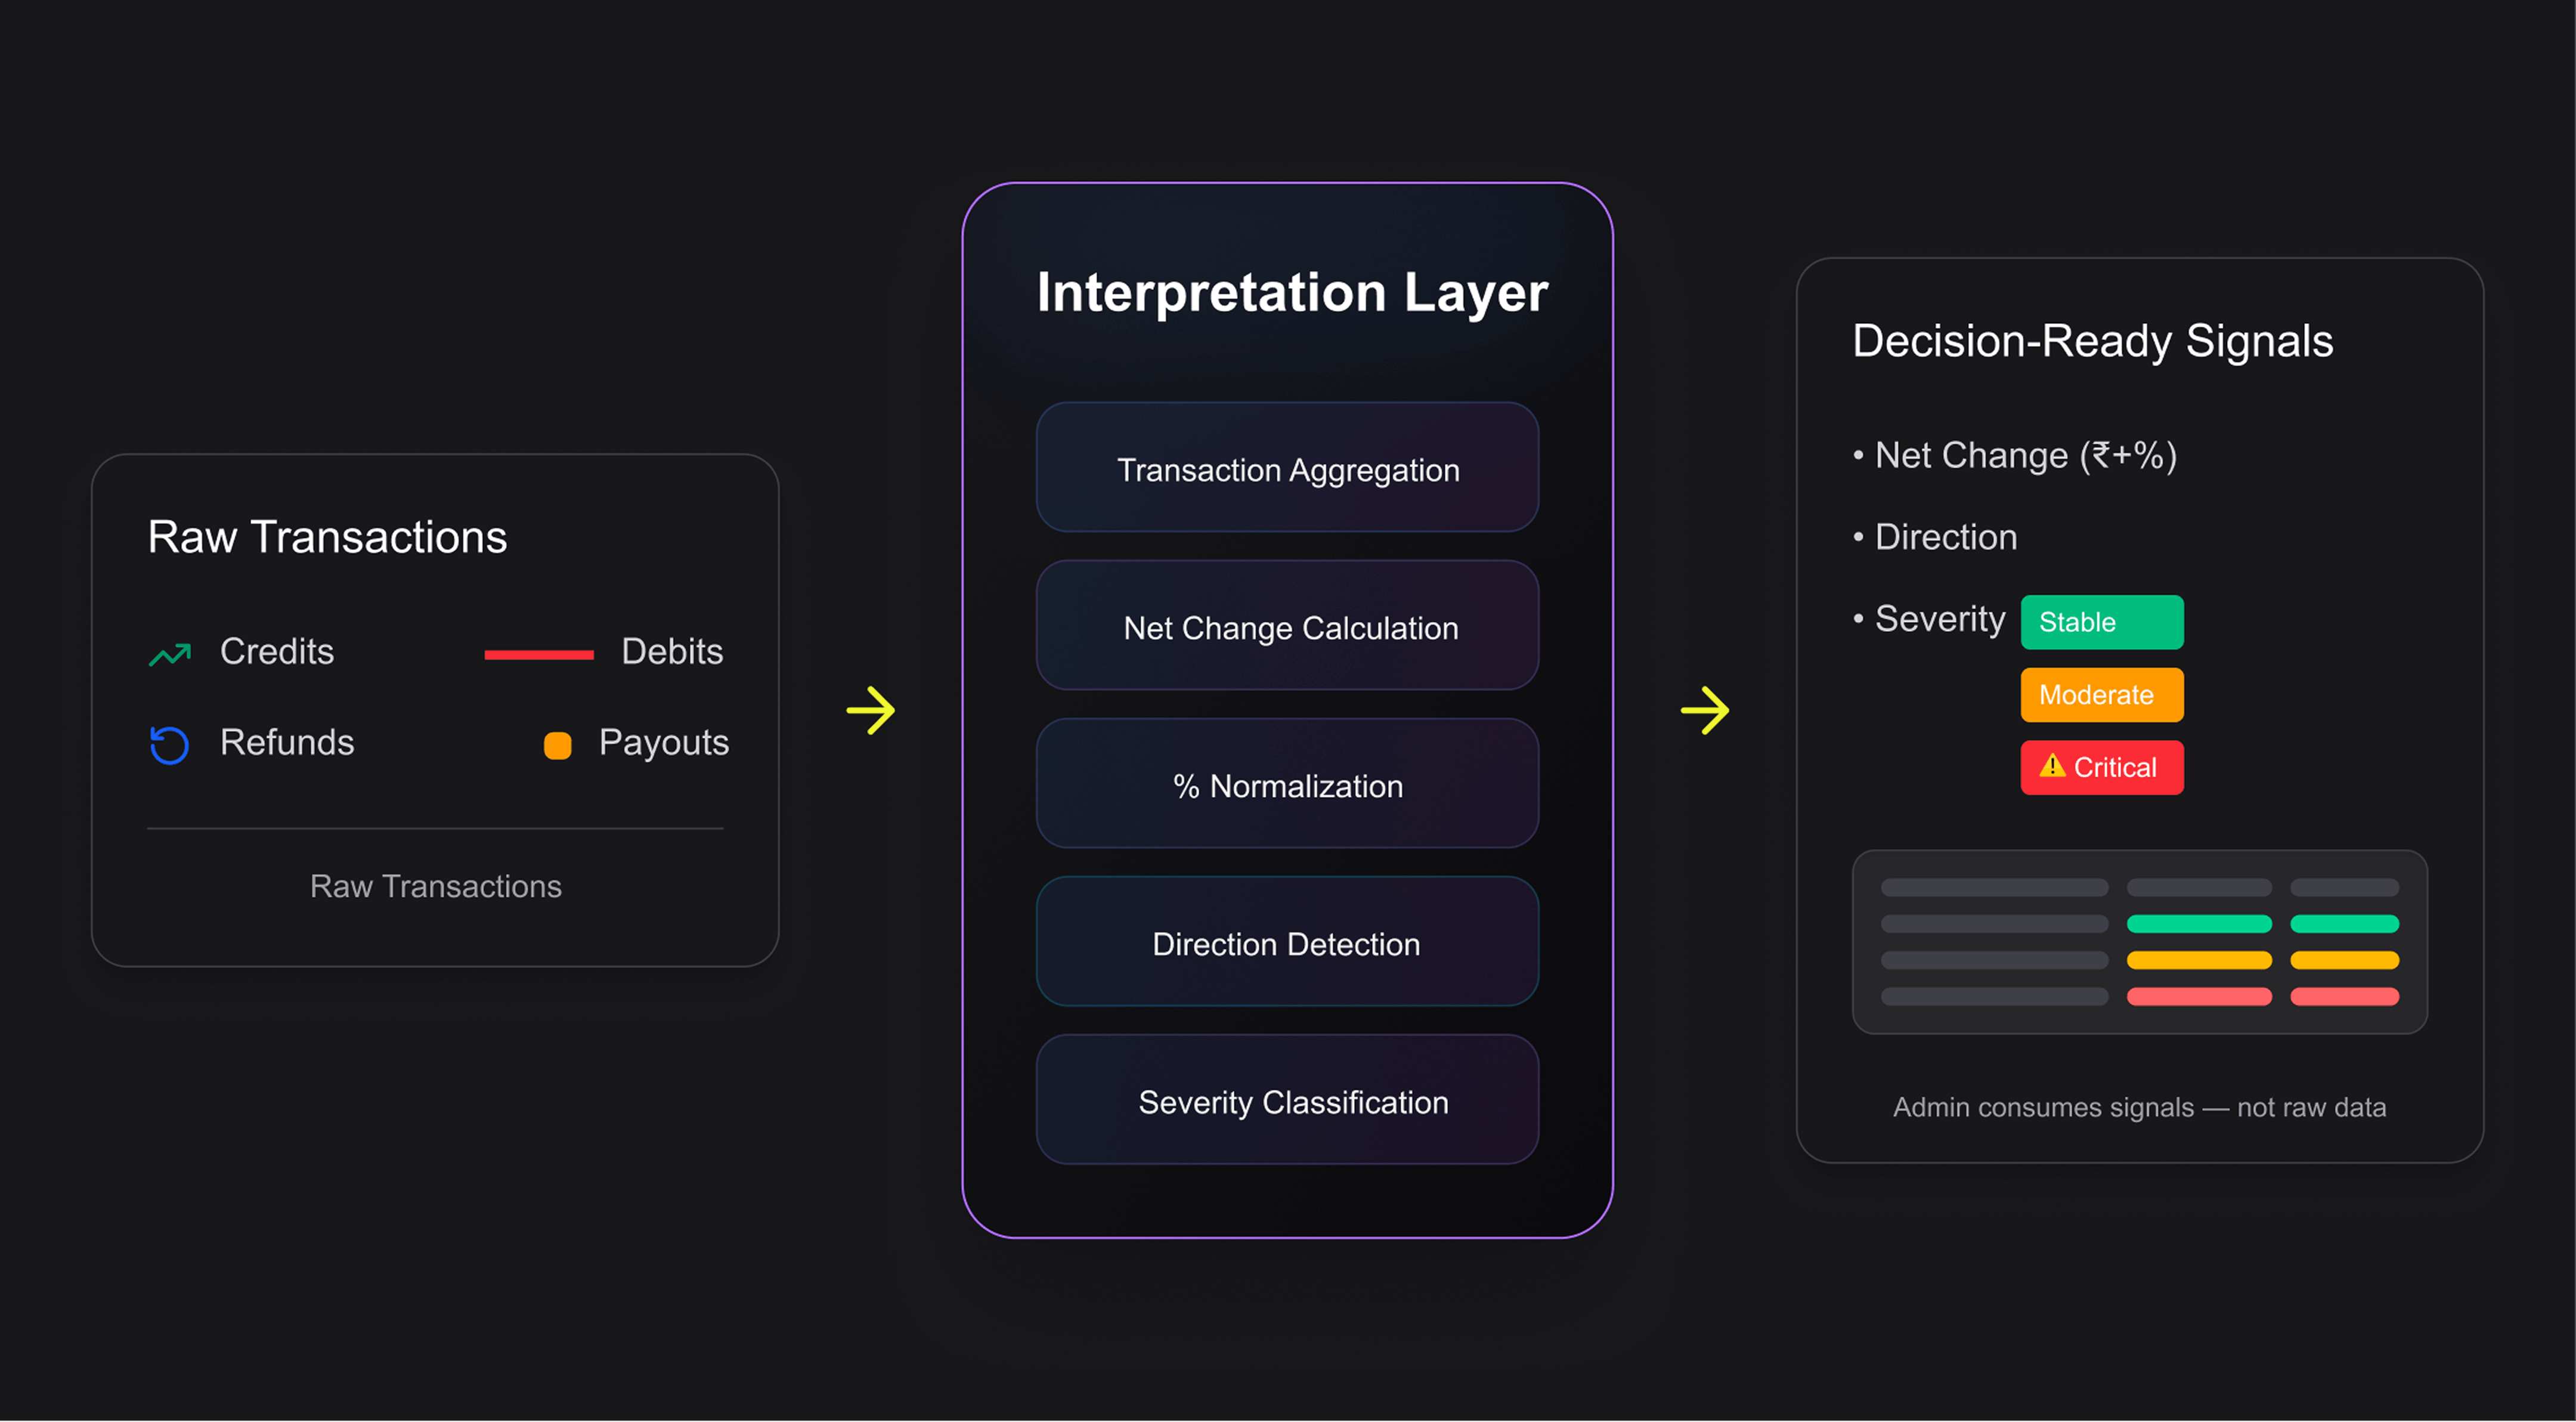
This layer is responsible for:
- aggregating transactions
- calculating movements
- normalizing change
- classifying severity
- communicating risk consistently
The UI becomes the “output of this system”, not the place where interpretation happens. This shift turns the dashboard from a “reporting tool” into a “decision-support system”.
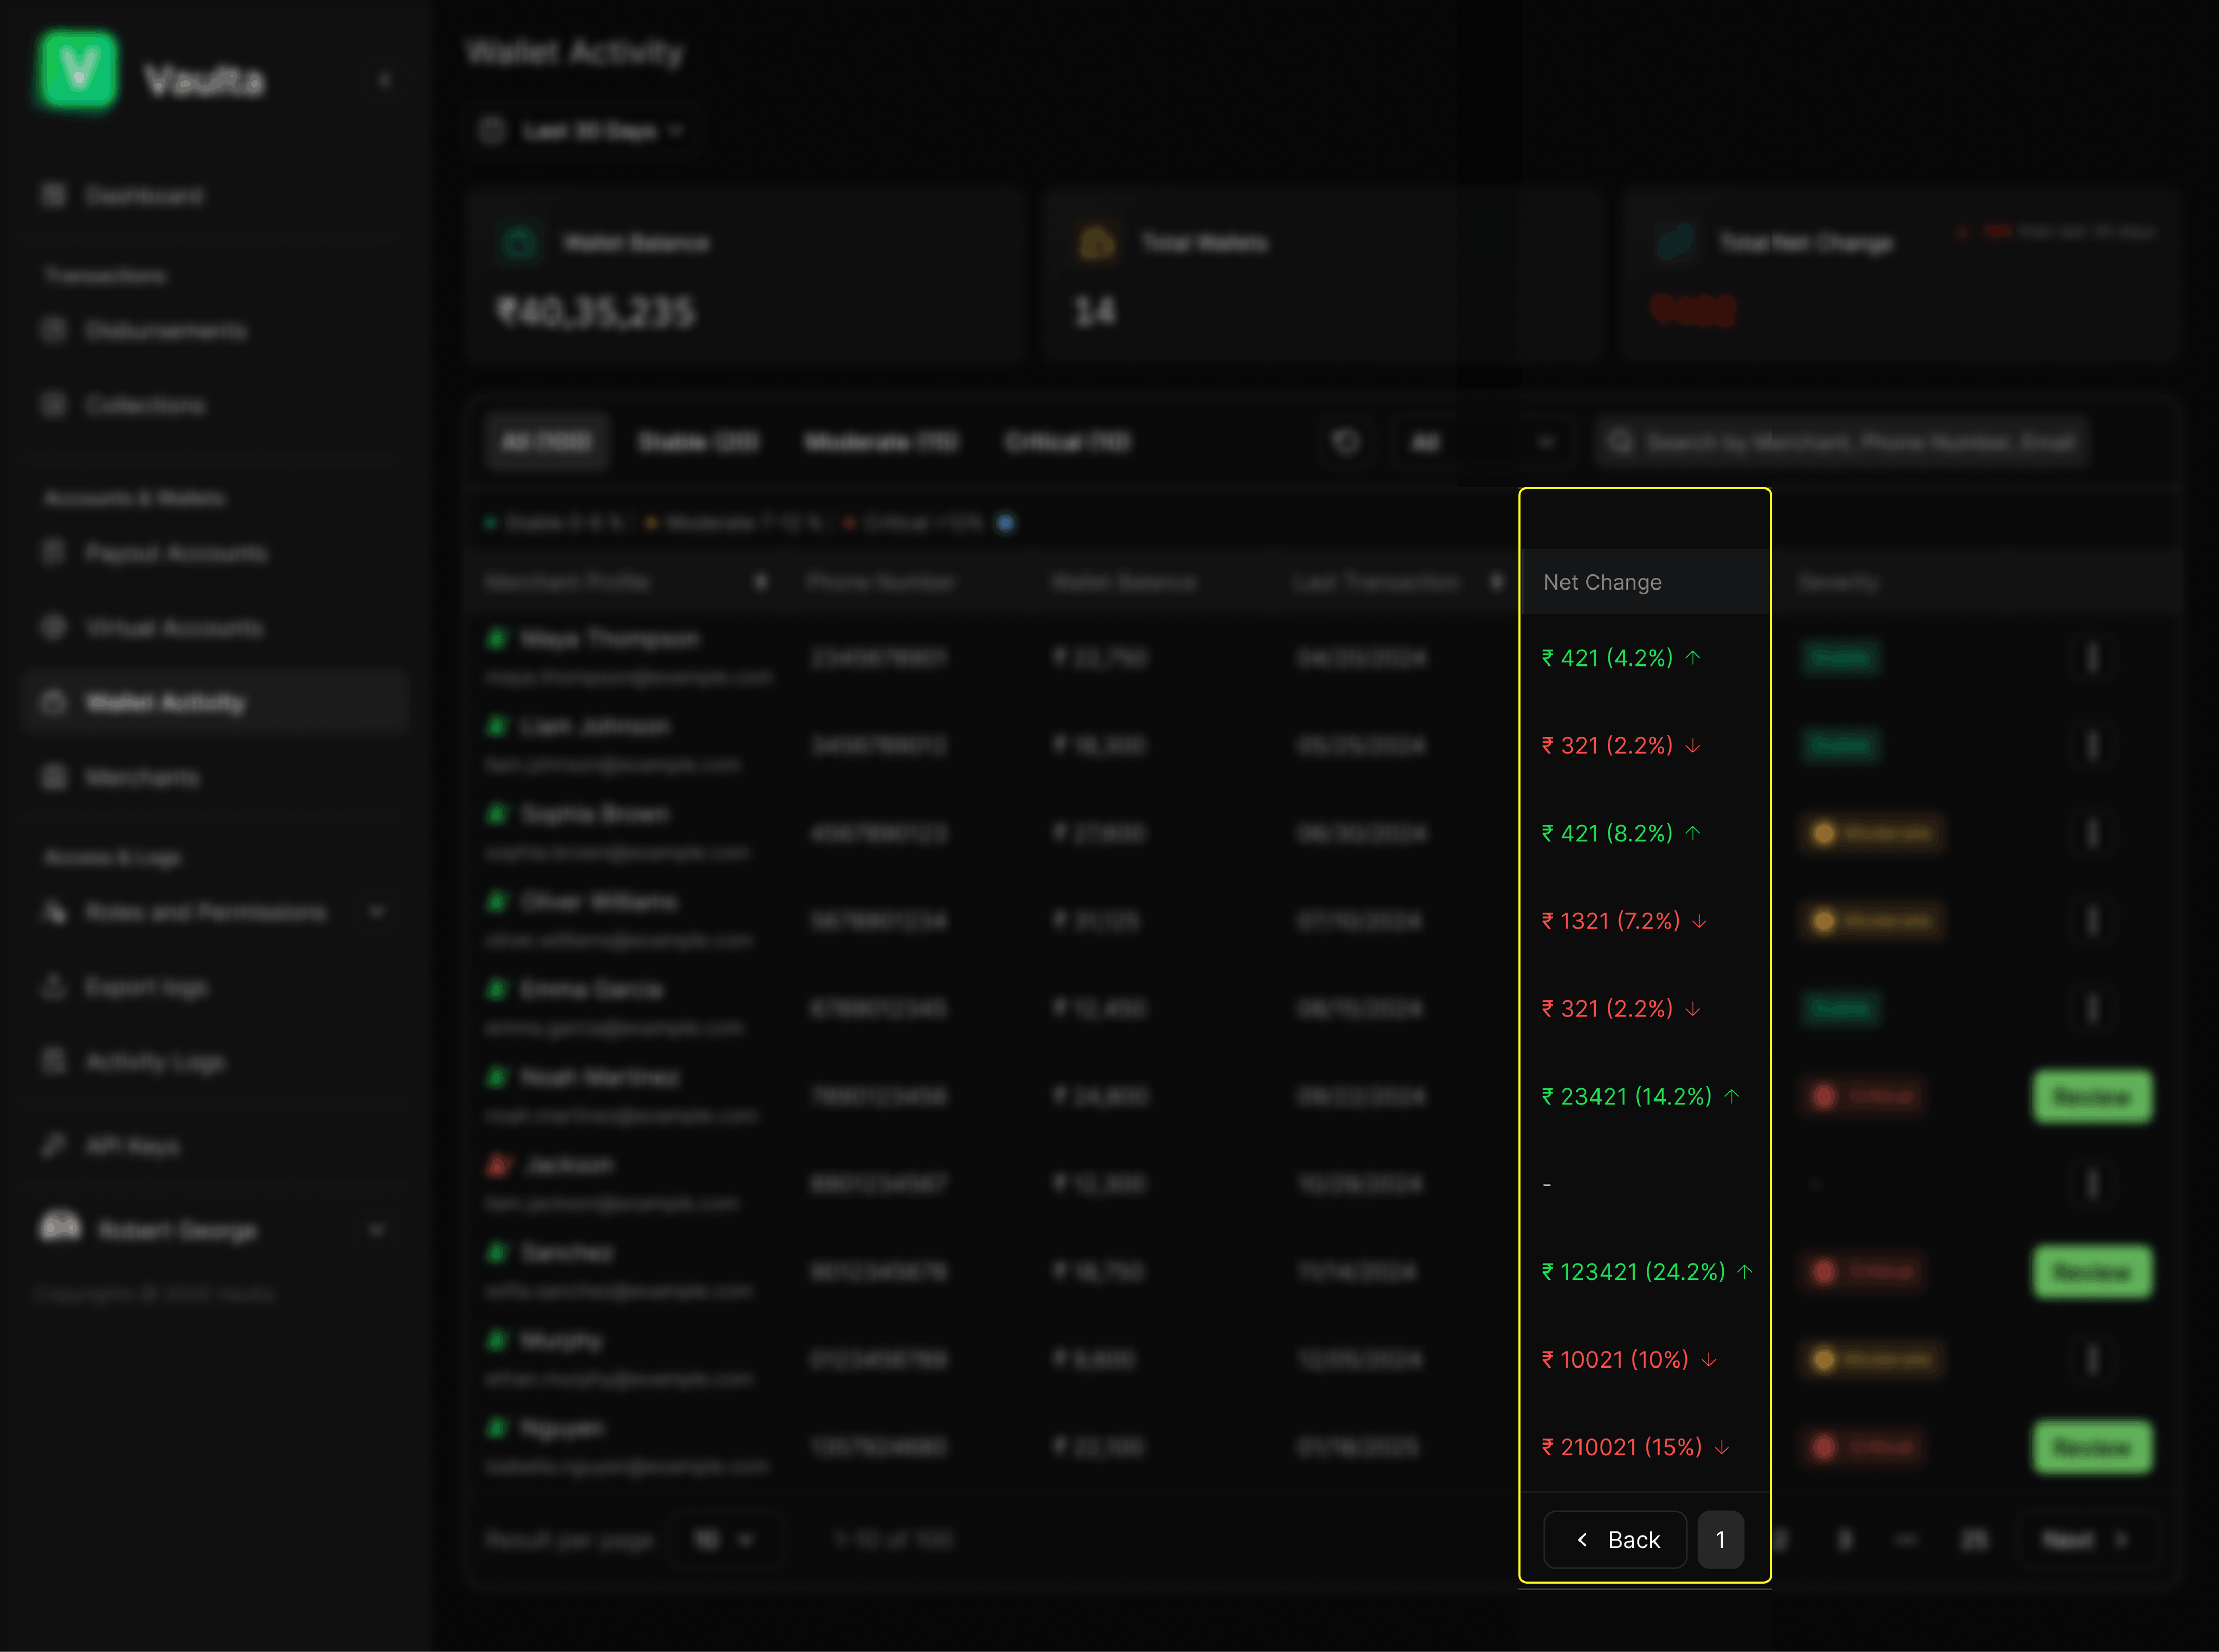
06 Introducing Net Change
To represent movement clearly, I introduced a new primary signal “Net Change”.
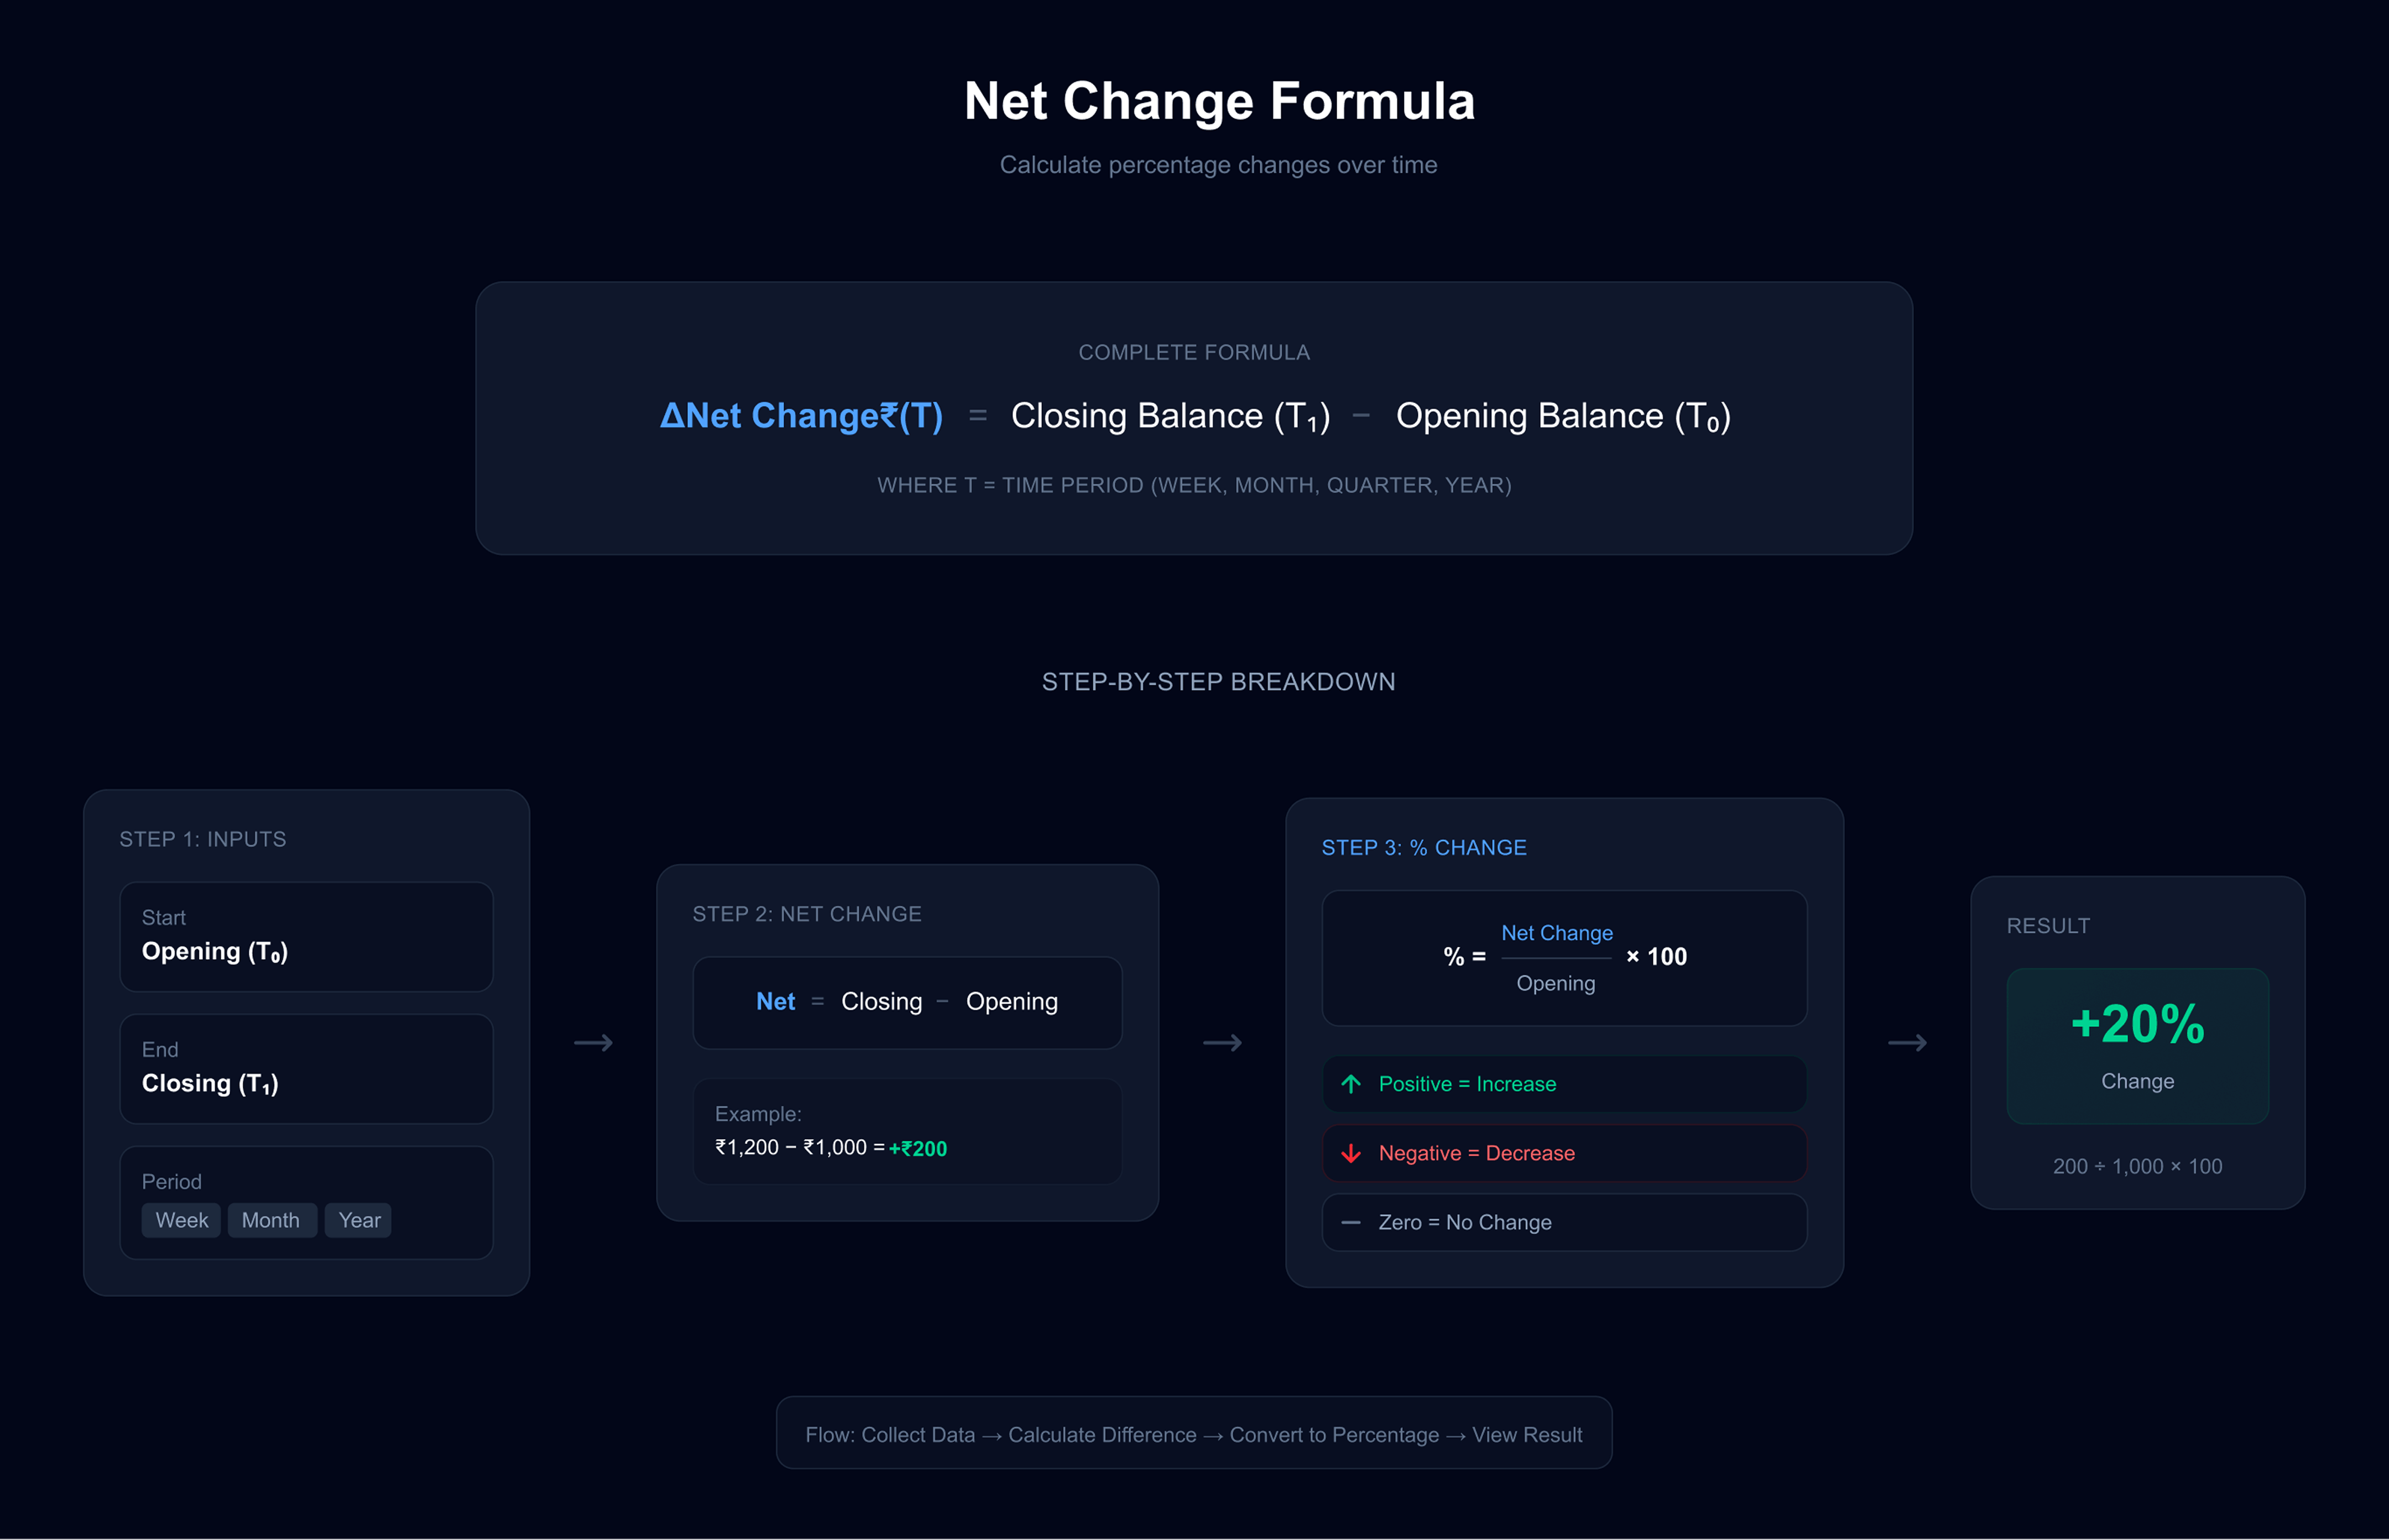
It compresses wallet activity
over a
defined time period into a single,
scannable signal by combining:
- Absolute value (₹) - the total amount of money that moved
- Percentage (%) - normalized movement relative to the opening balance
- Direction (↑ / ↓) - whether the balance increased or decreased
By anchoring change to a specific time window and normalizing it across merchants, Net Change allows admins to immediately understand what changed without manual comparison or mental calculation.
07 Separating Direction from Risk
A critical design decision was to decouple direction from severity.
1. Direction answers: *What happened ?*
2. Magnitude answers: *How serious is it ?*
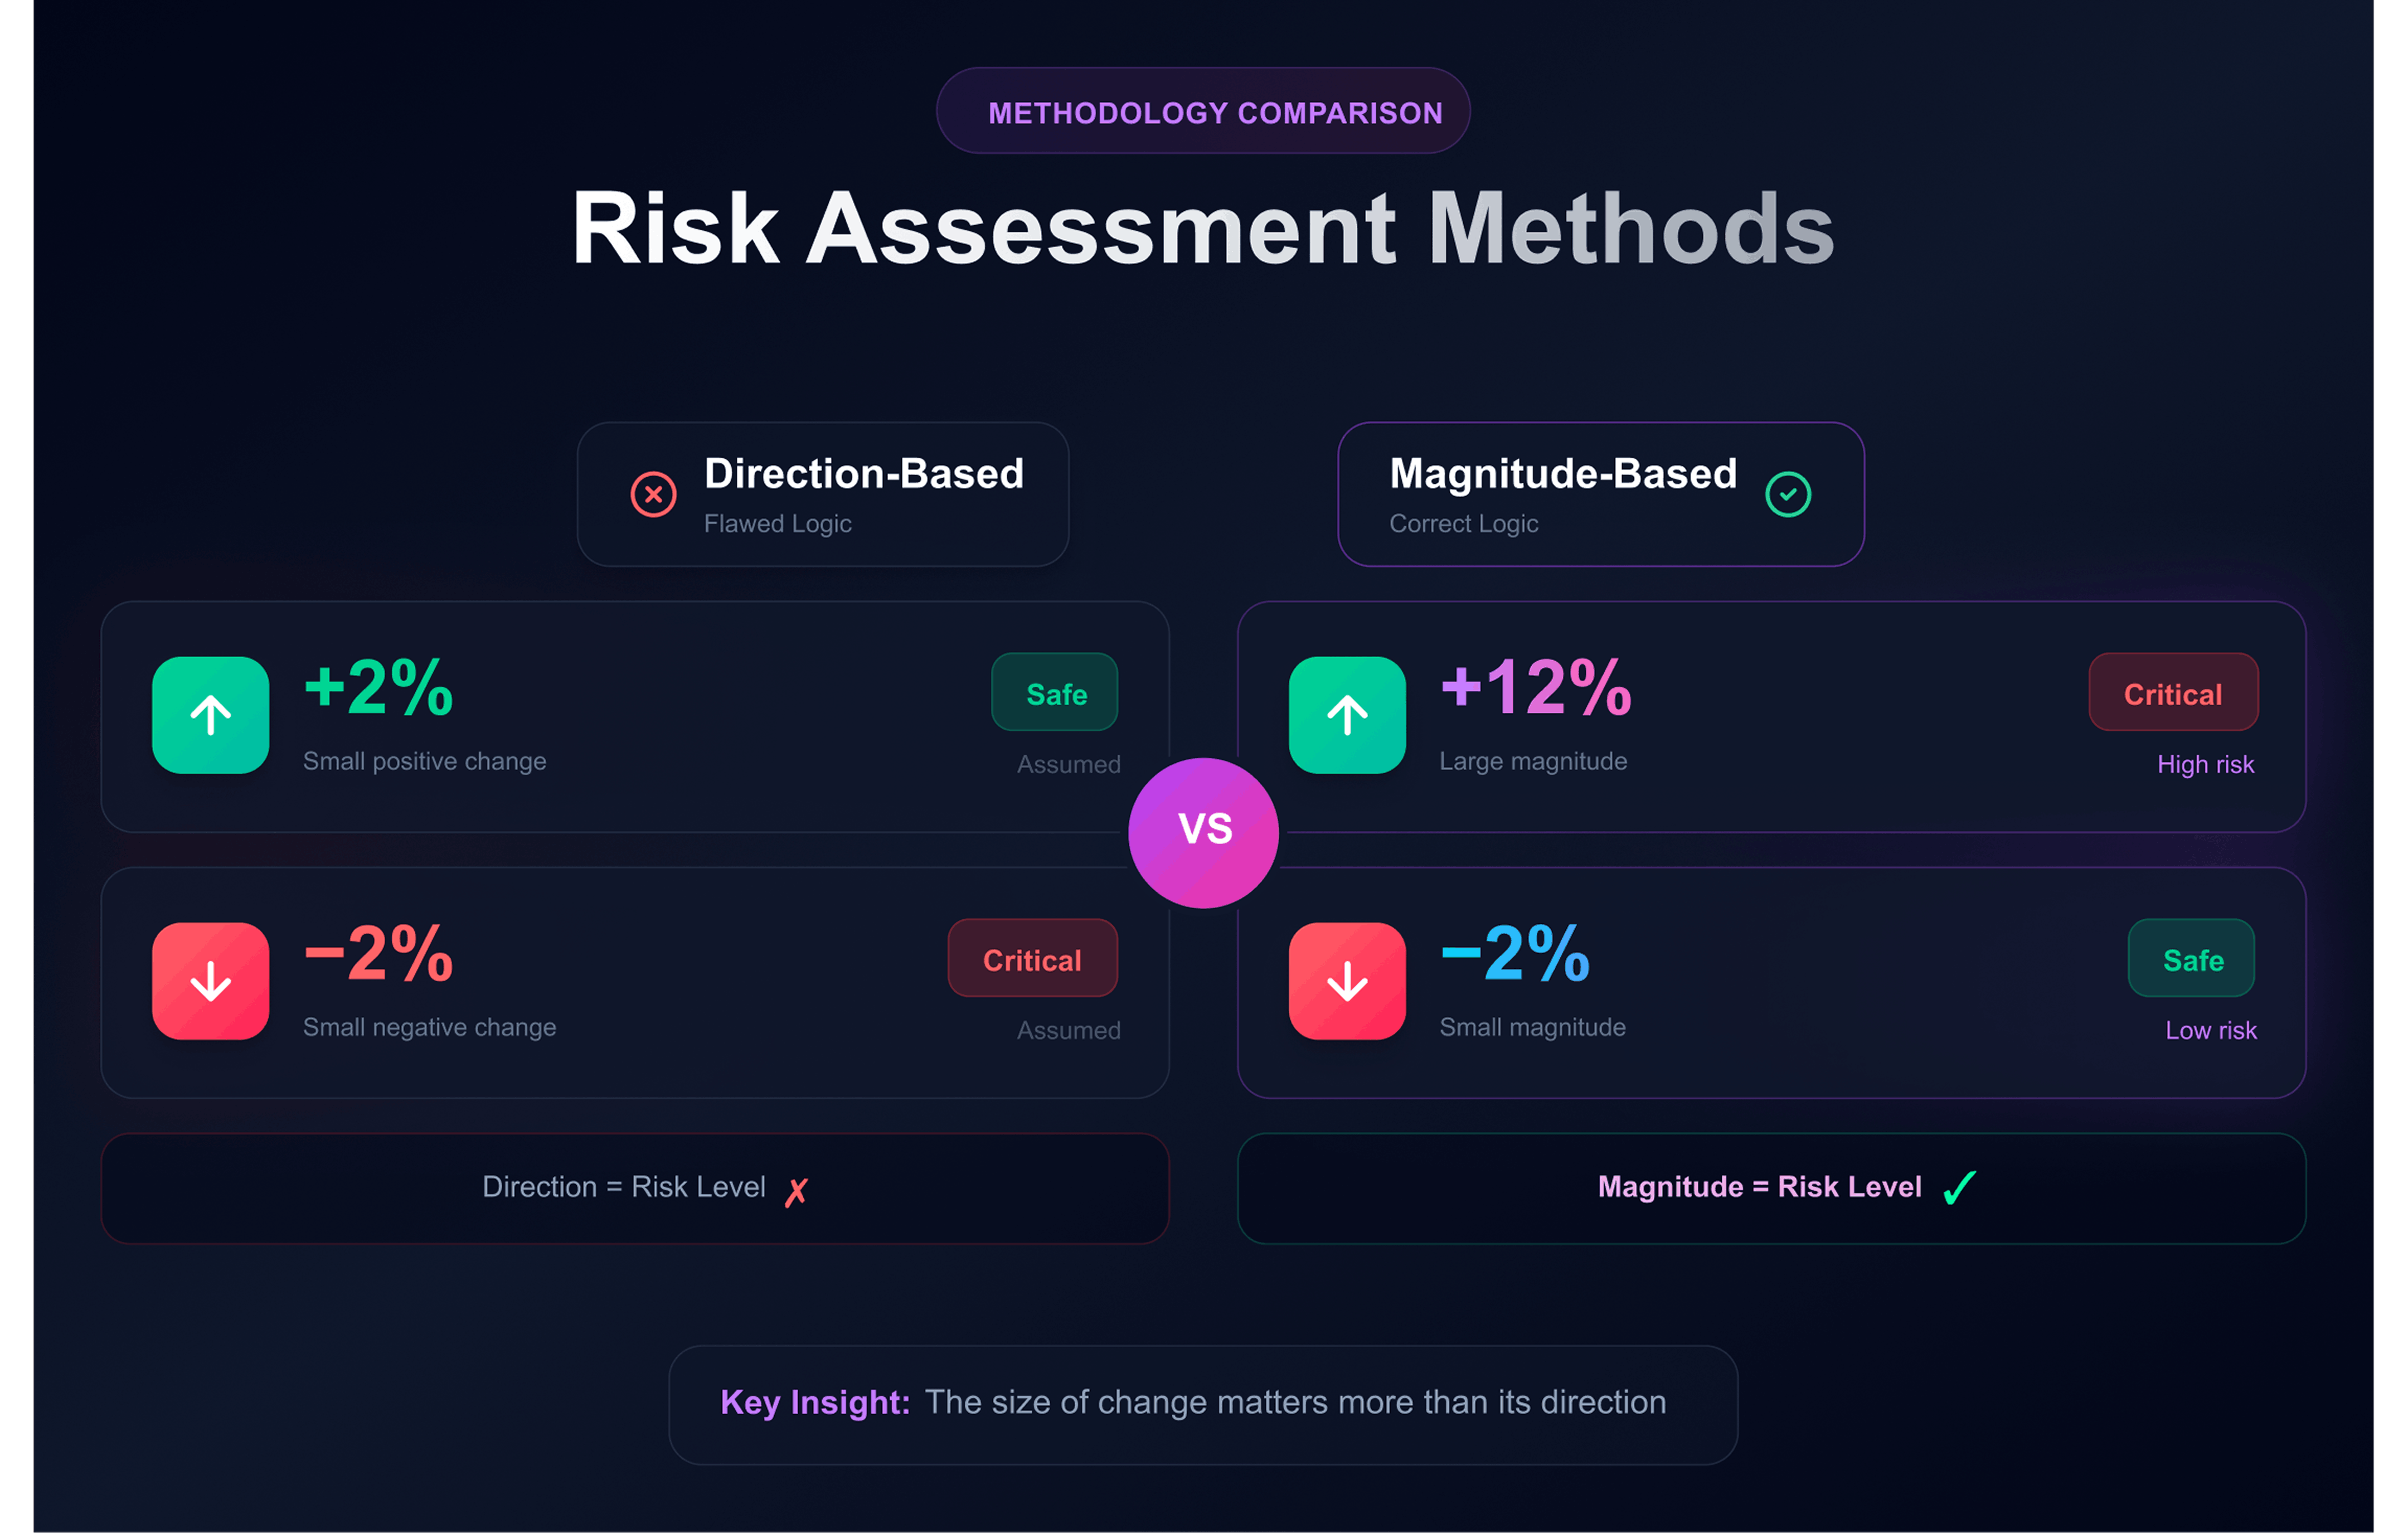
In financial systems:
- a large positive spike can indicate fraud or reconciliation errors
- a large negative drop can indicate refund spikes or merchant distress
Both are operational risks.
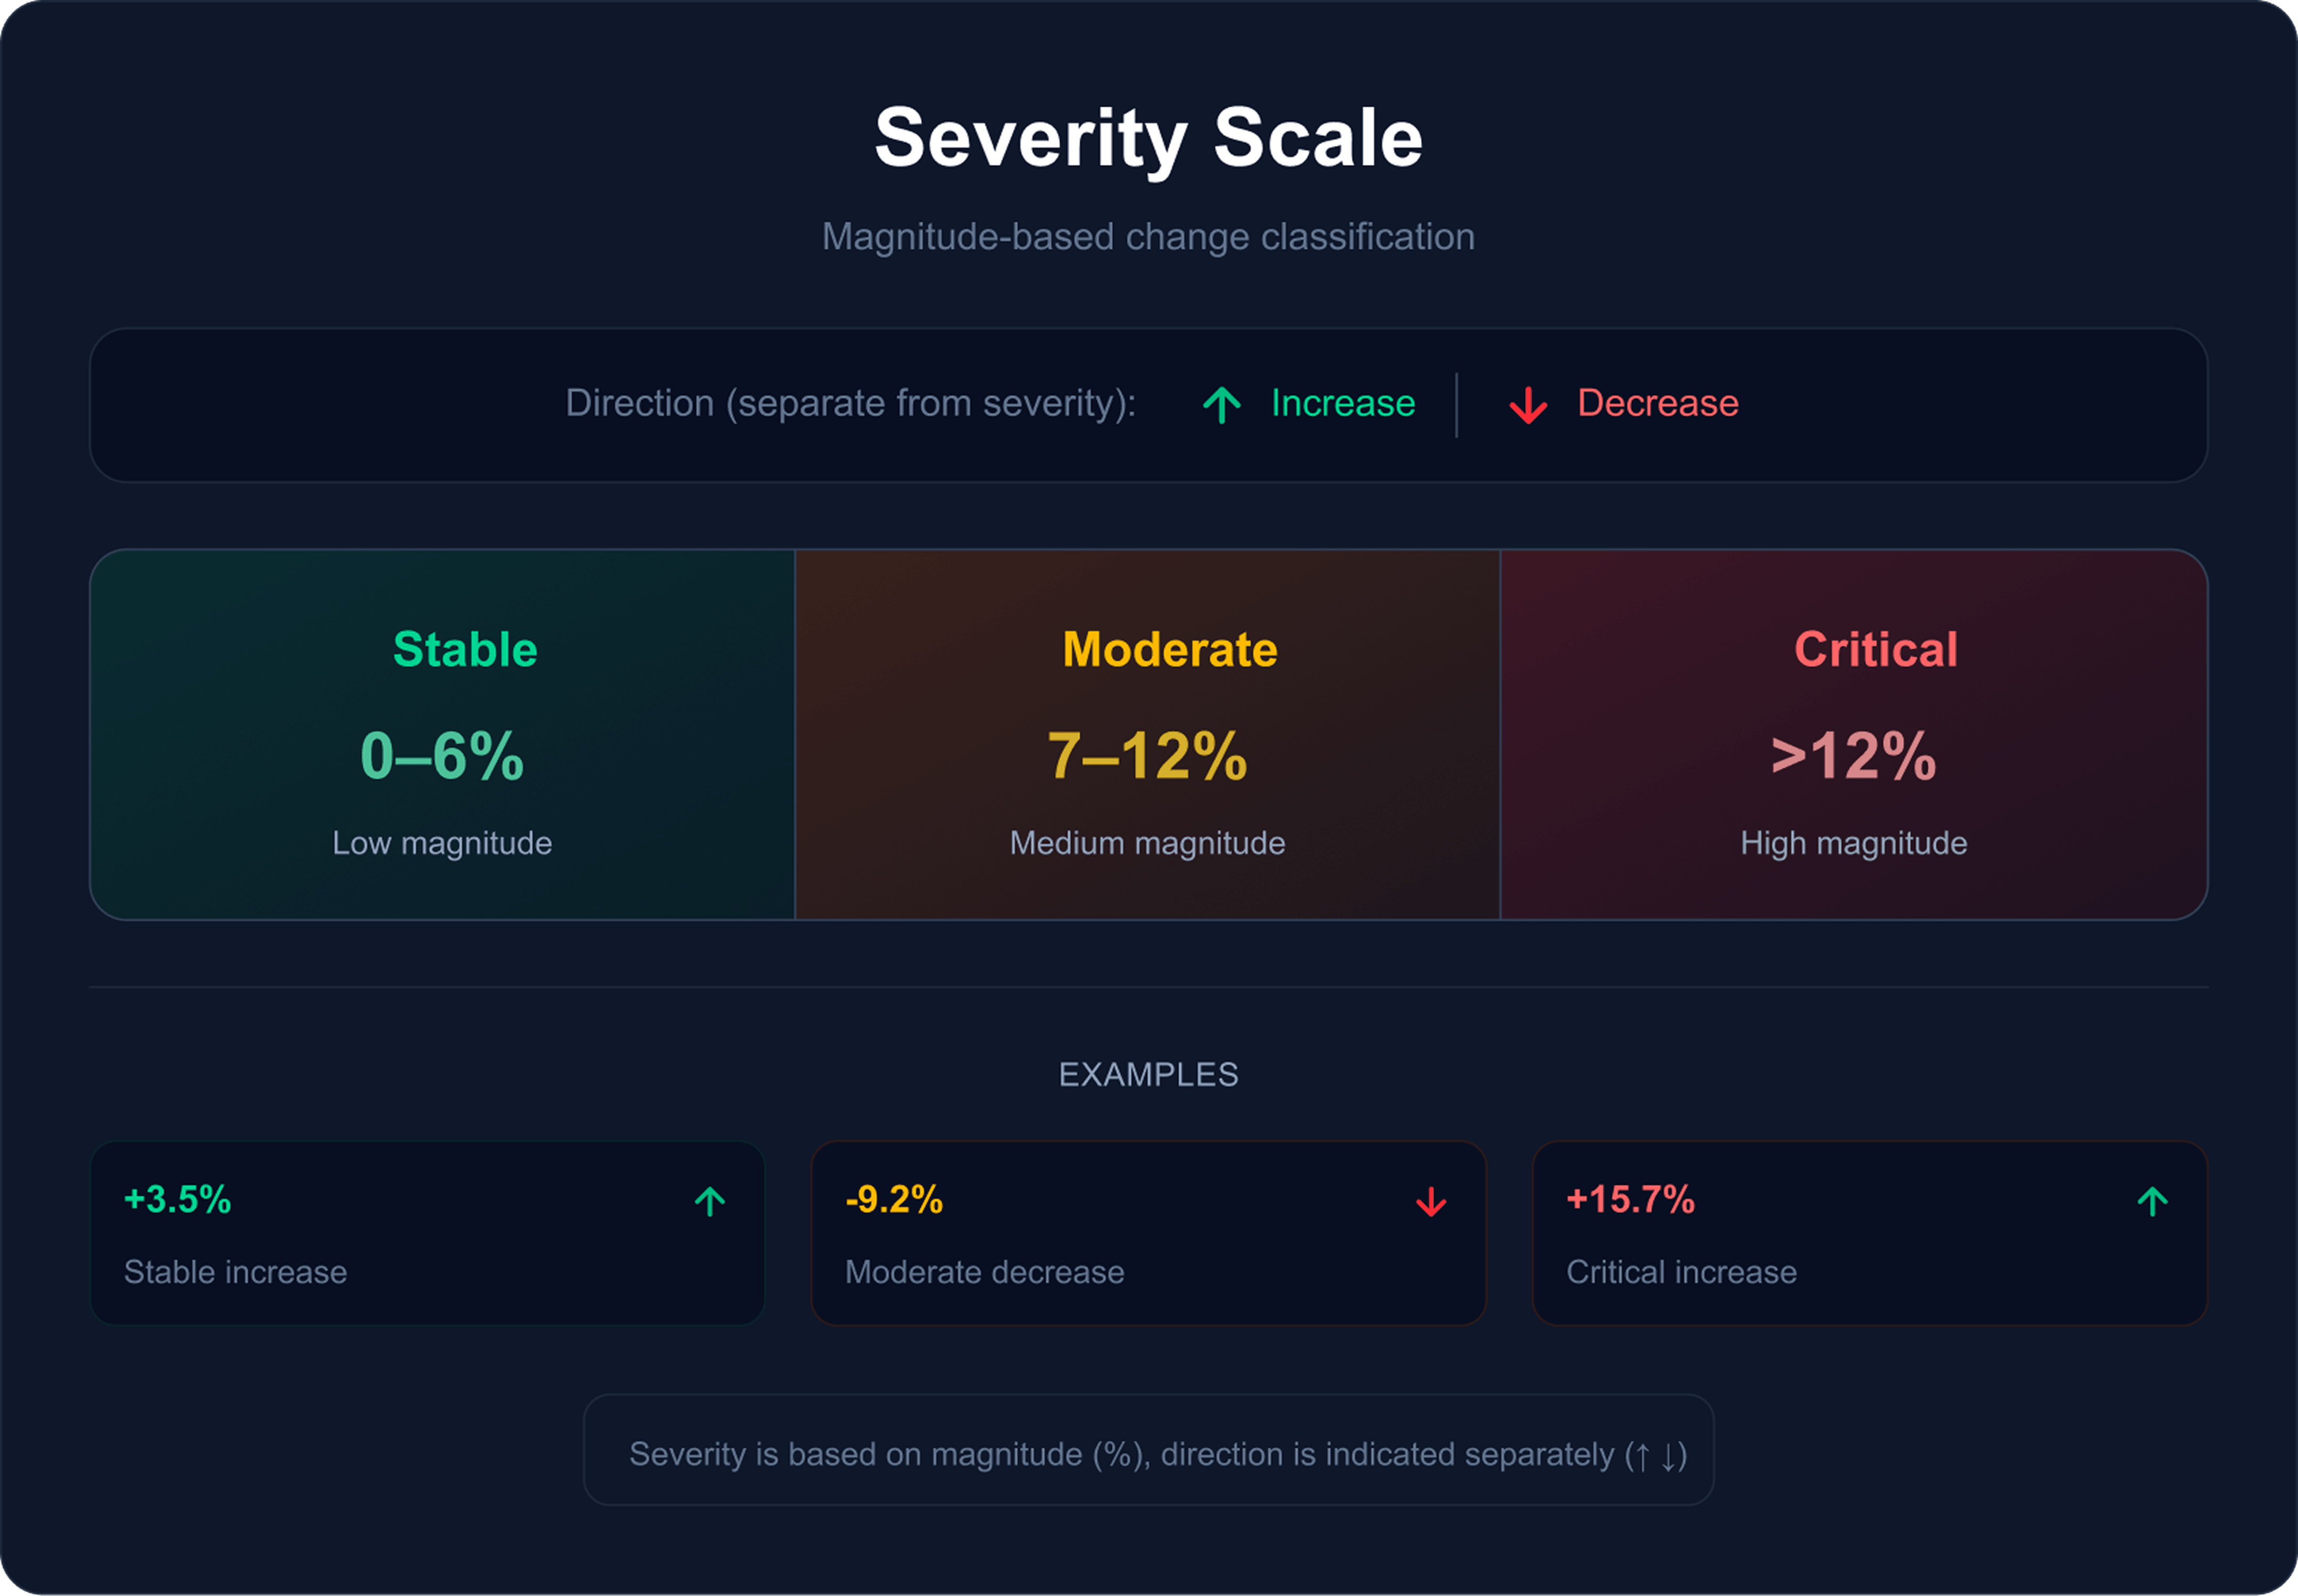
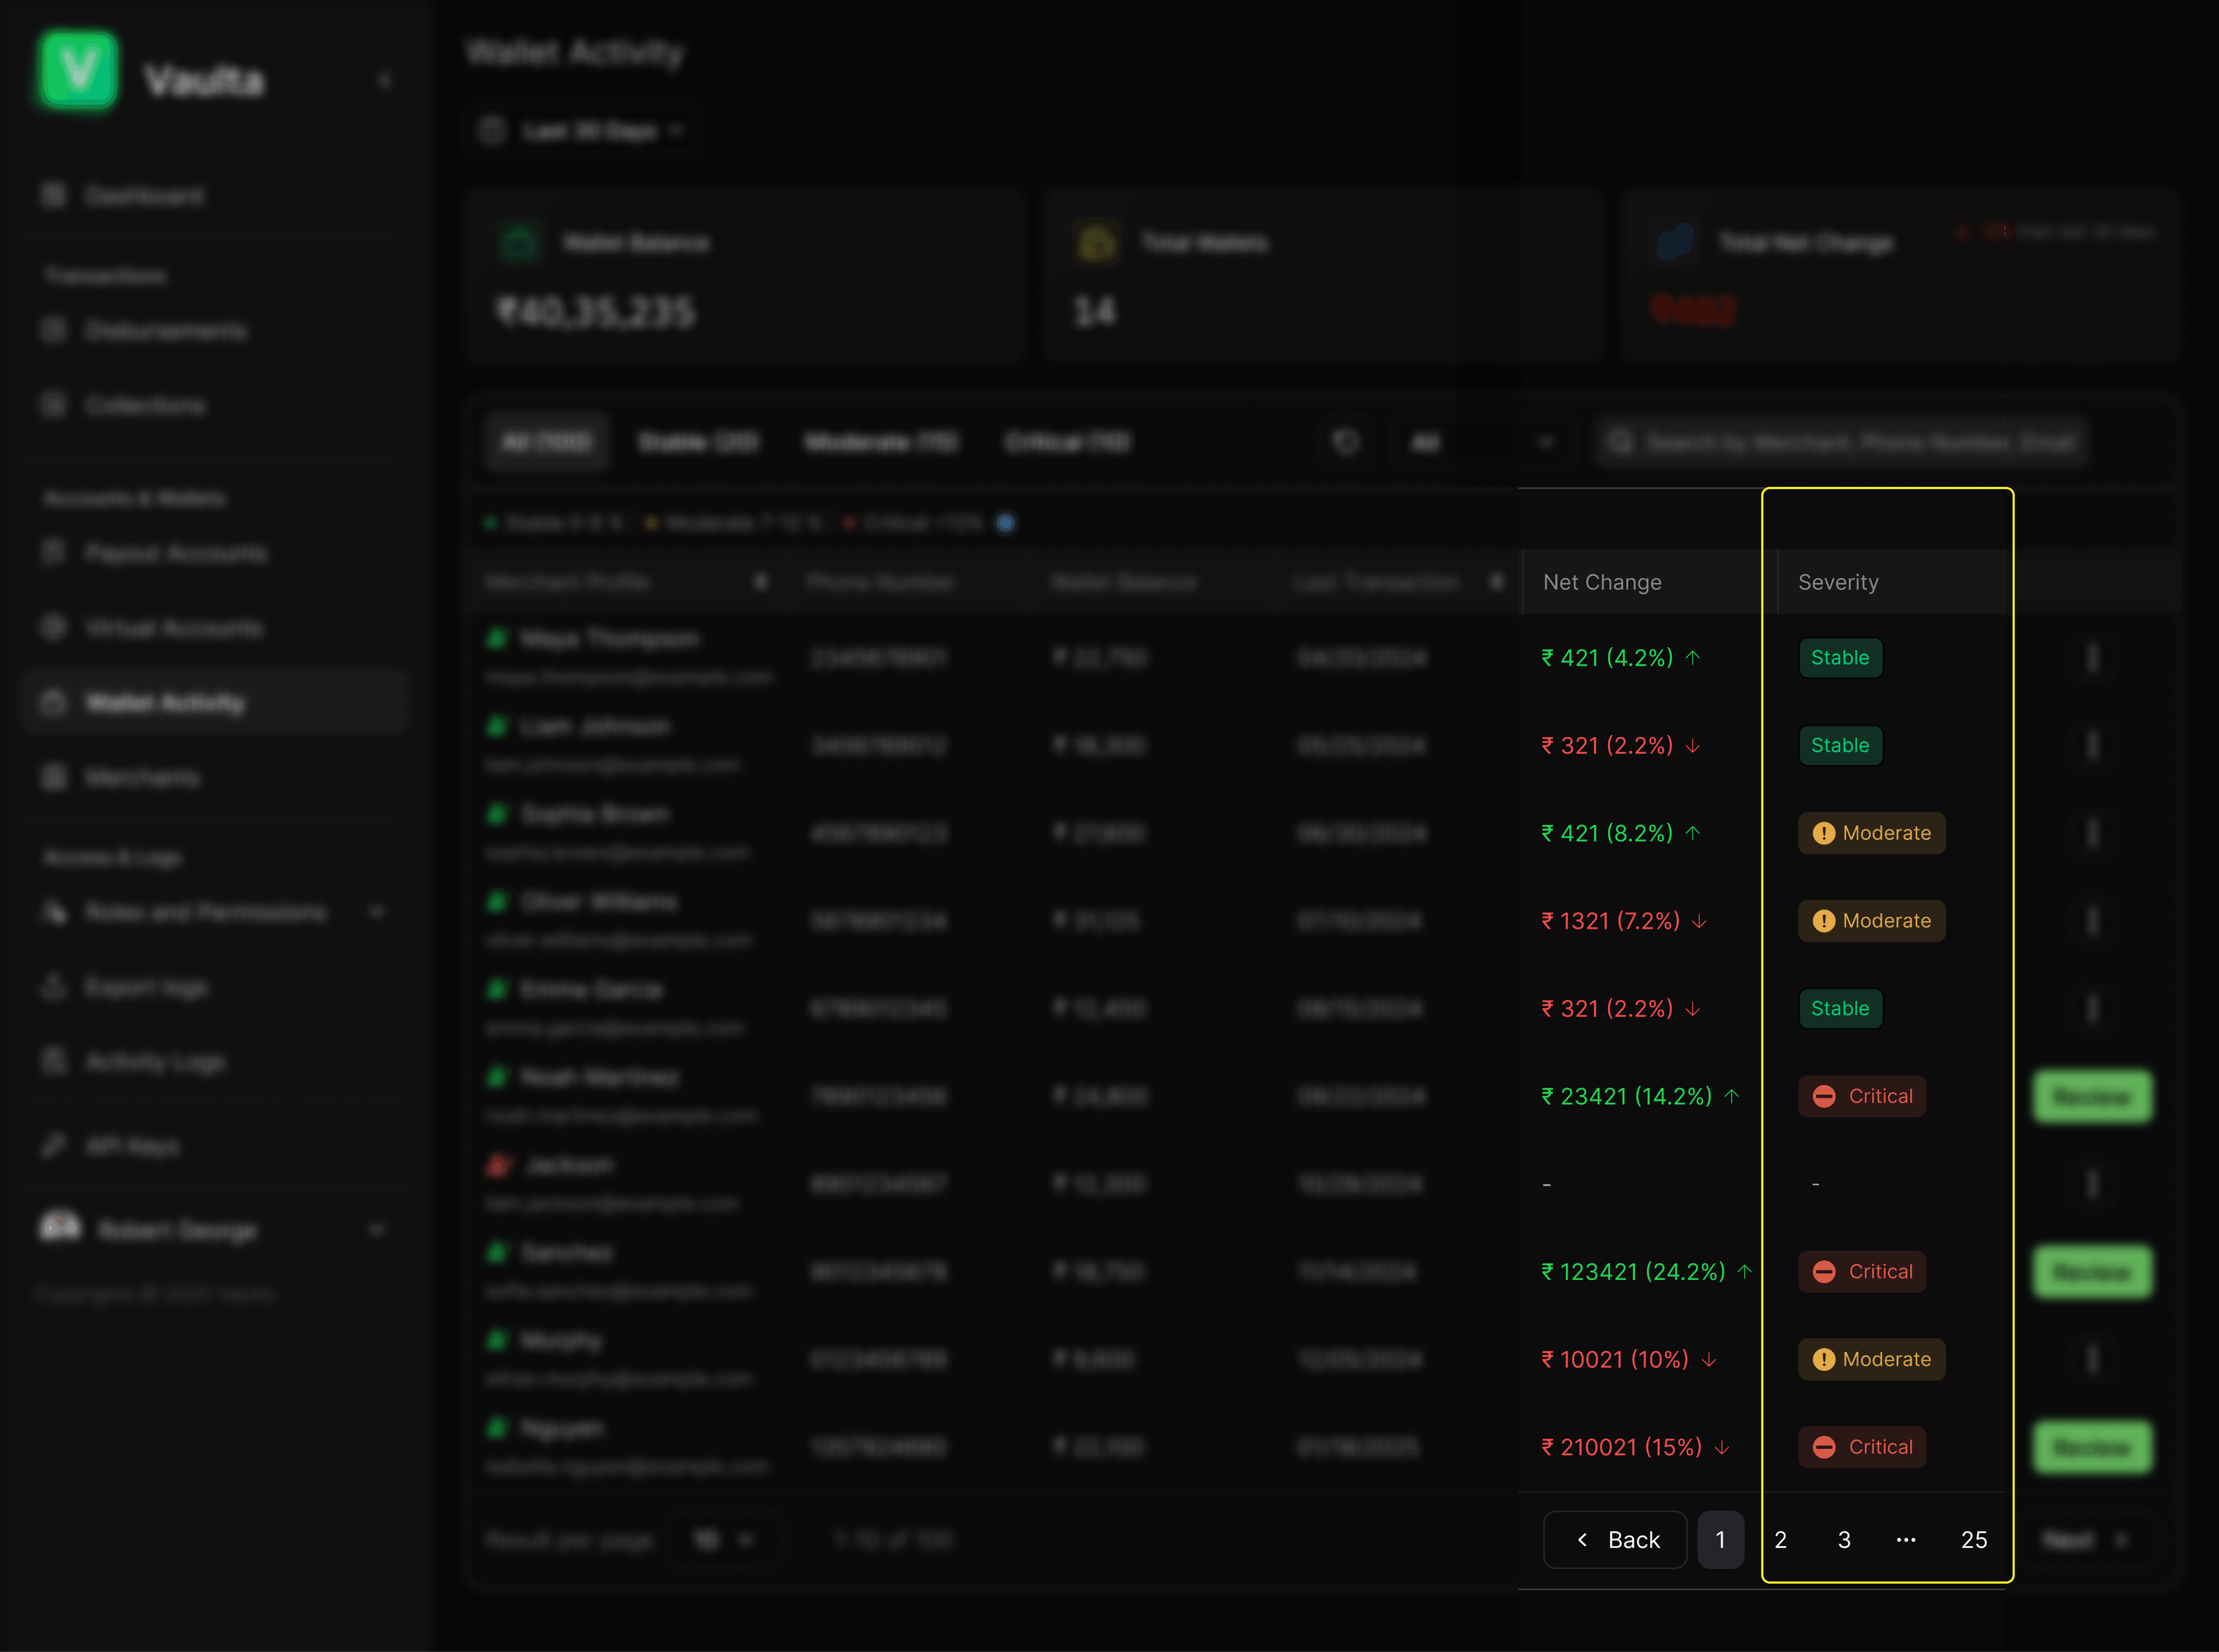
08 Designing the Severity Model
These thresholds are designed to absorb expected financial volatility, reduce false positives, surface meaningful anomalies, and maintain trust in system decisions, with arrows indicating direction and severity conveying risk.
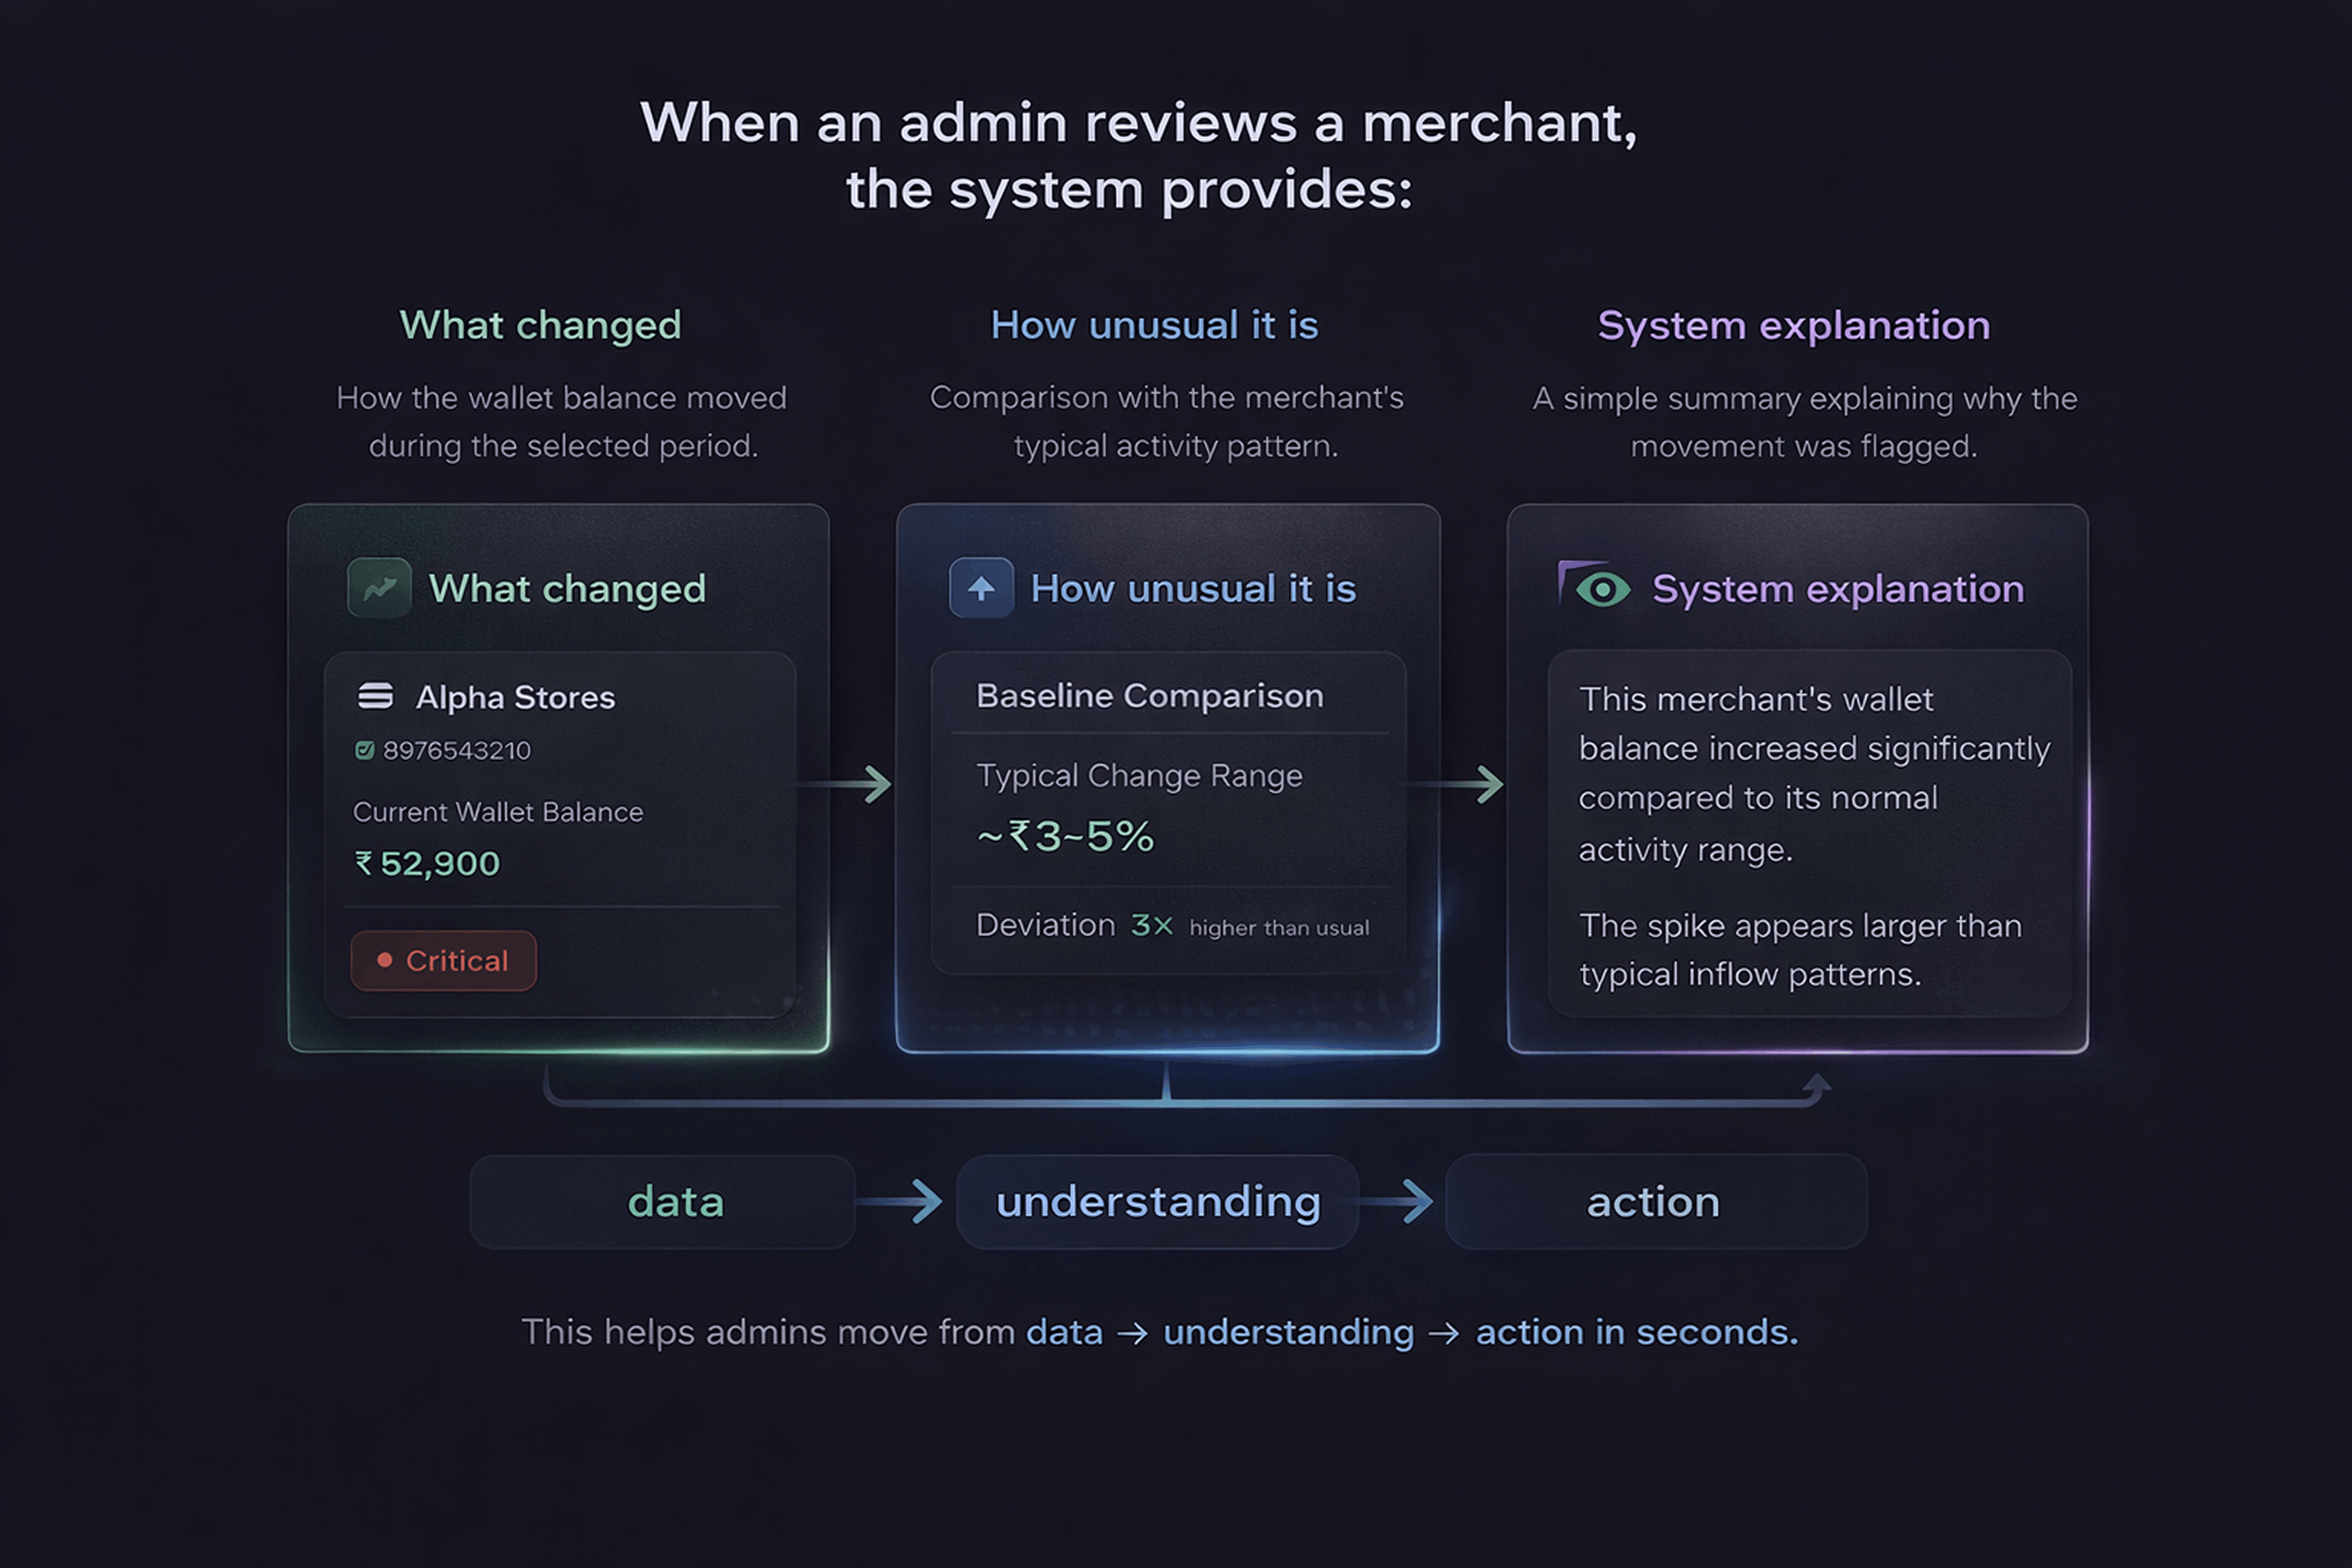
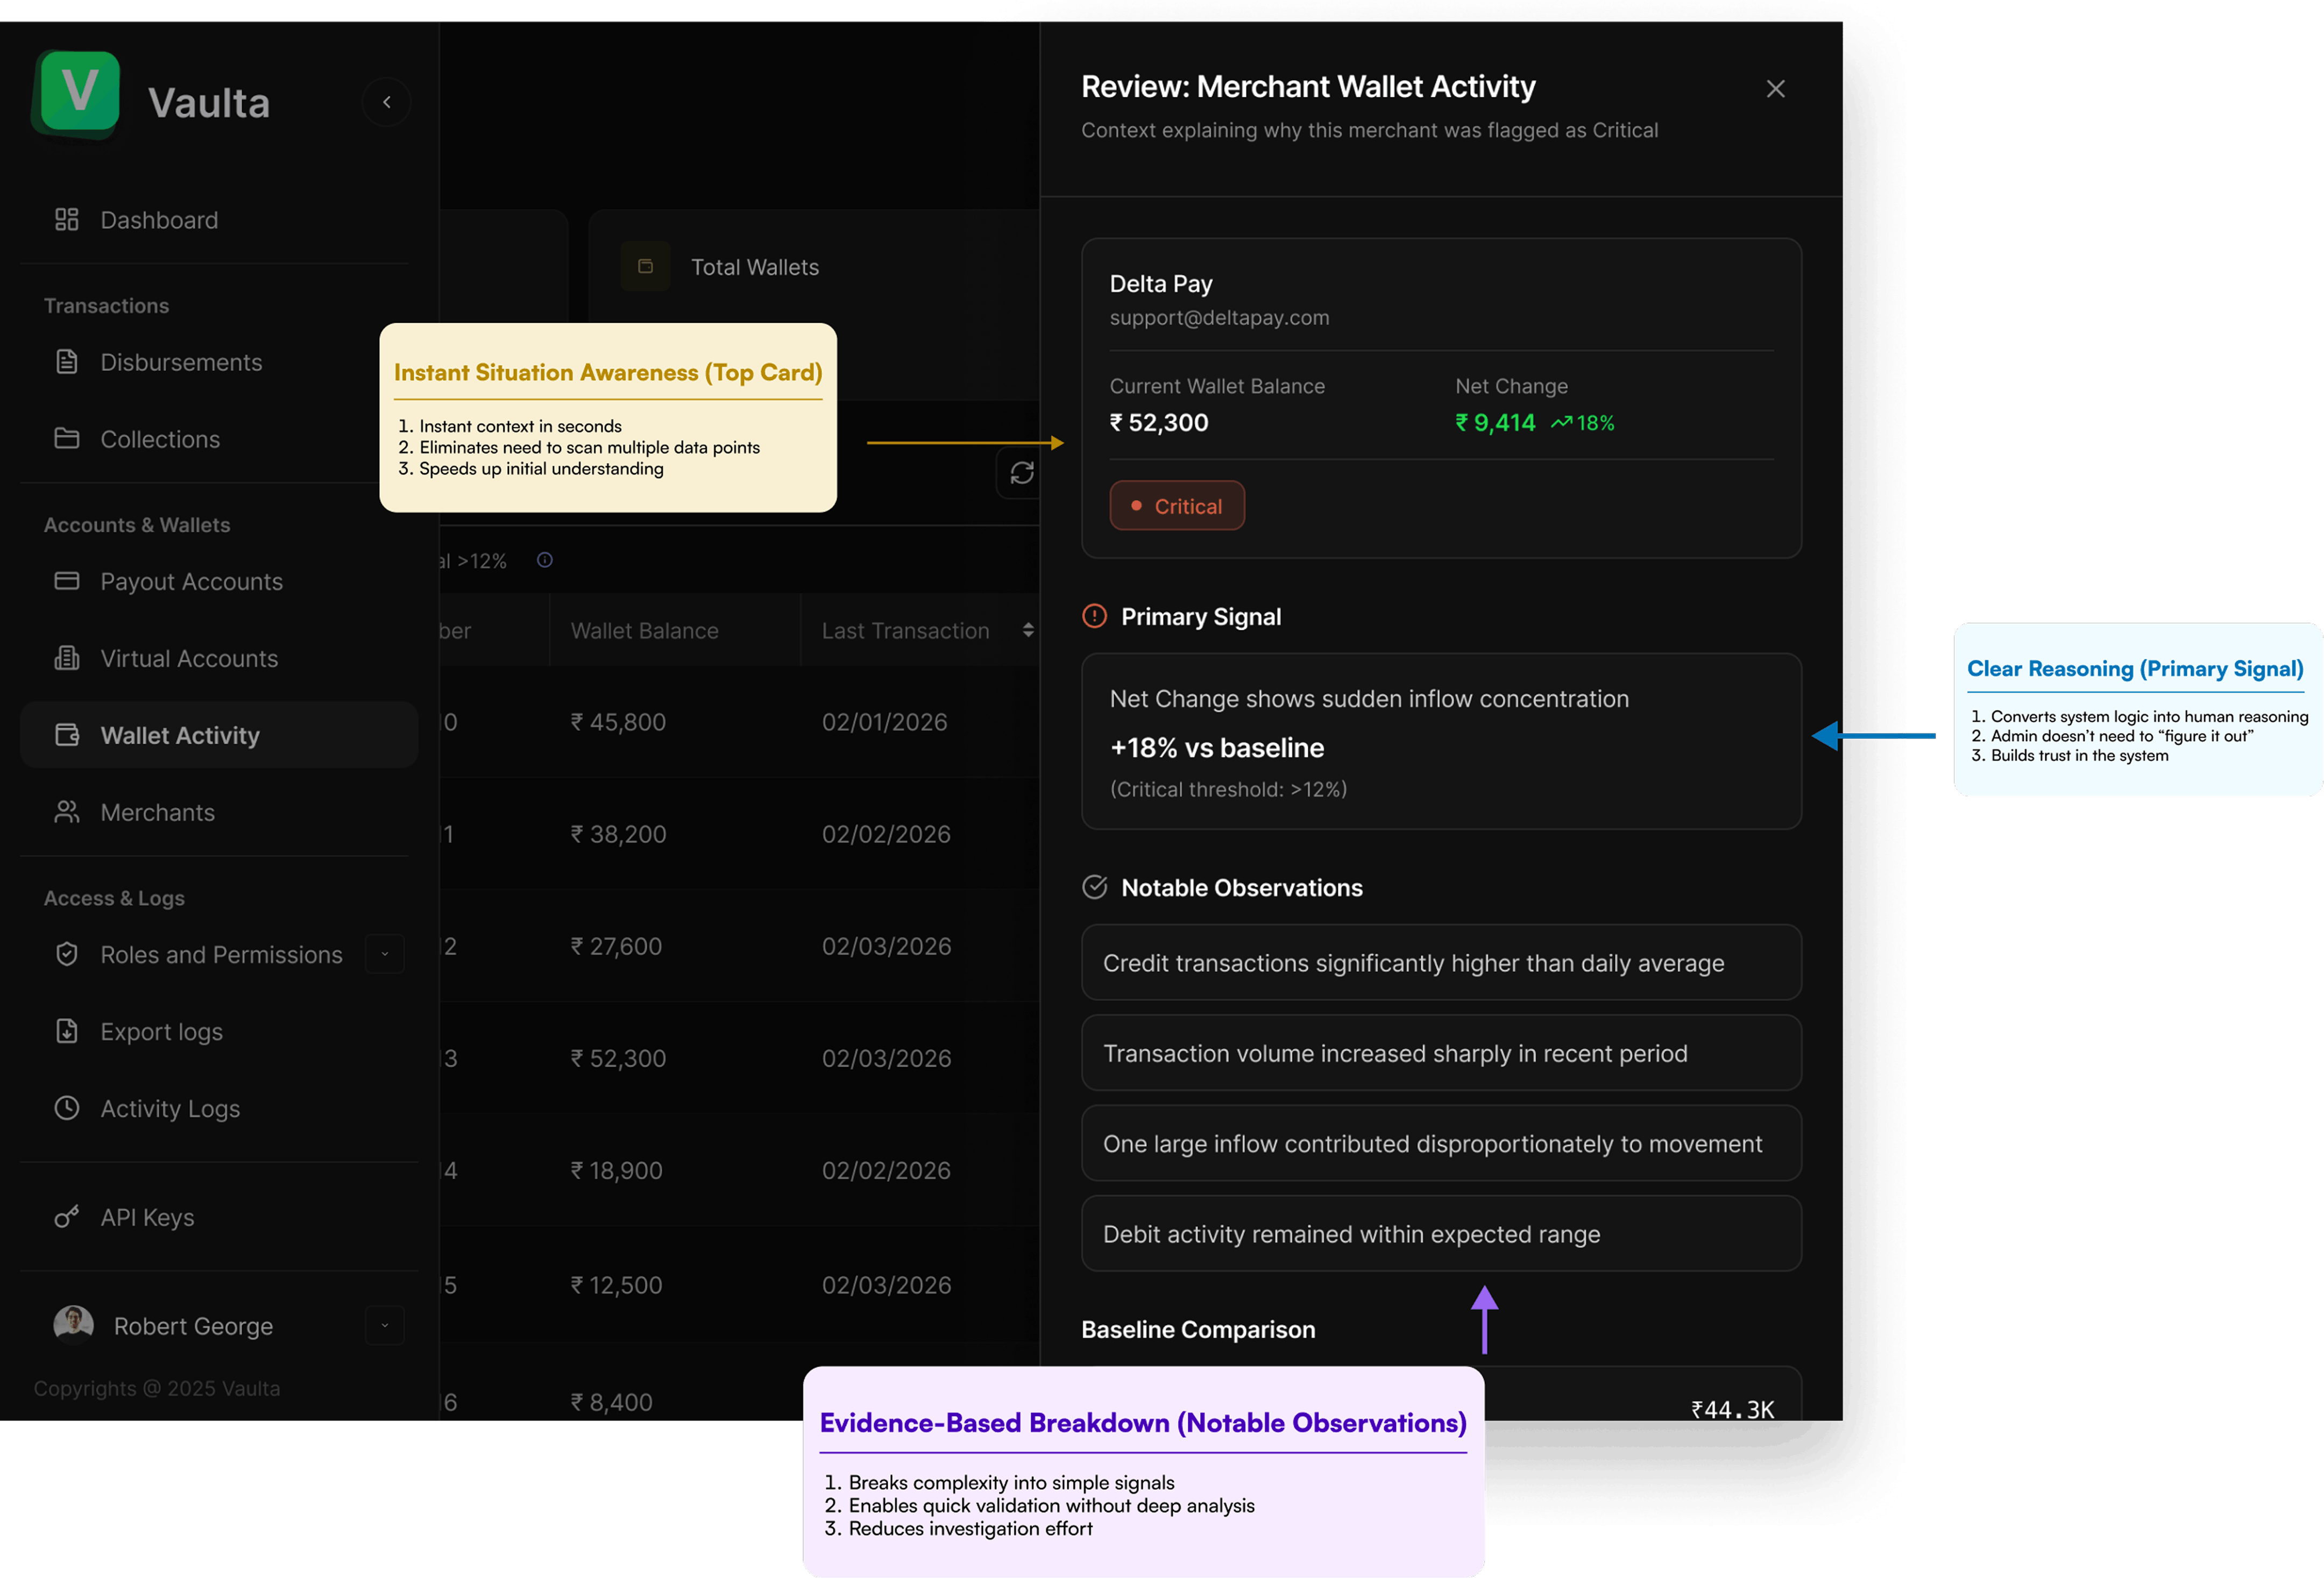
09 Explanation Layer
Detecting movement alone is not enough.Admins also need to understand why the system flagged a merchant.
To support this, I designed an Explanation Layer that translates system analysis into simple reasoning. When an admin opens a merchant row, the system answers three quick questions.
10 Table Architecture: How the System Communicates Intelligence
1. Primary Signal: Net Change
Net Change is the primary signal surfaced by the system, combining value, percentage, and direction into a single, scannable unit.
2. Contextual Risk: Severity Classification
Severity communicates risk based on magnitude, not direction, allowing admins to prioritize attention instantly.
3. Transparent Logic: Inline Legend
The system explains its own thresholds inline, making classification logic visible and trustworthy.
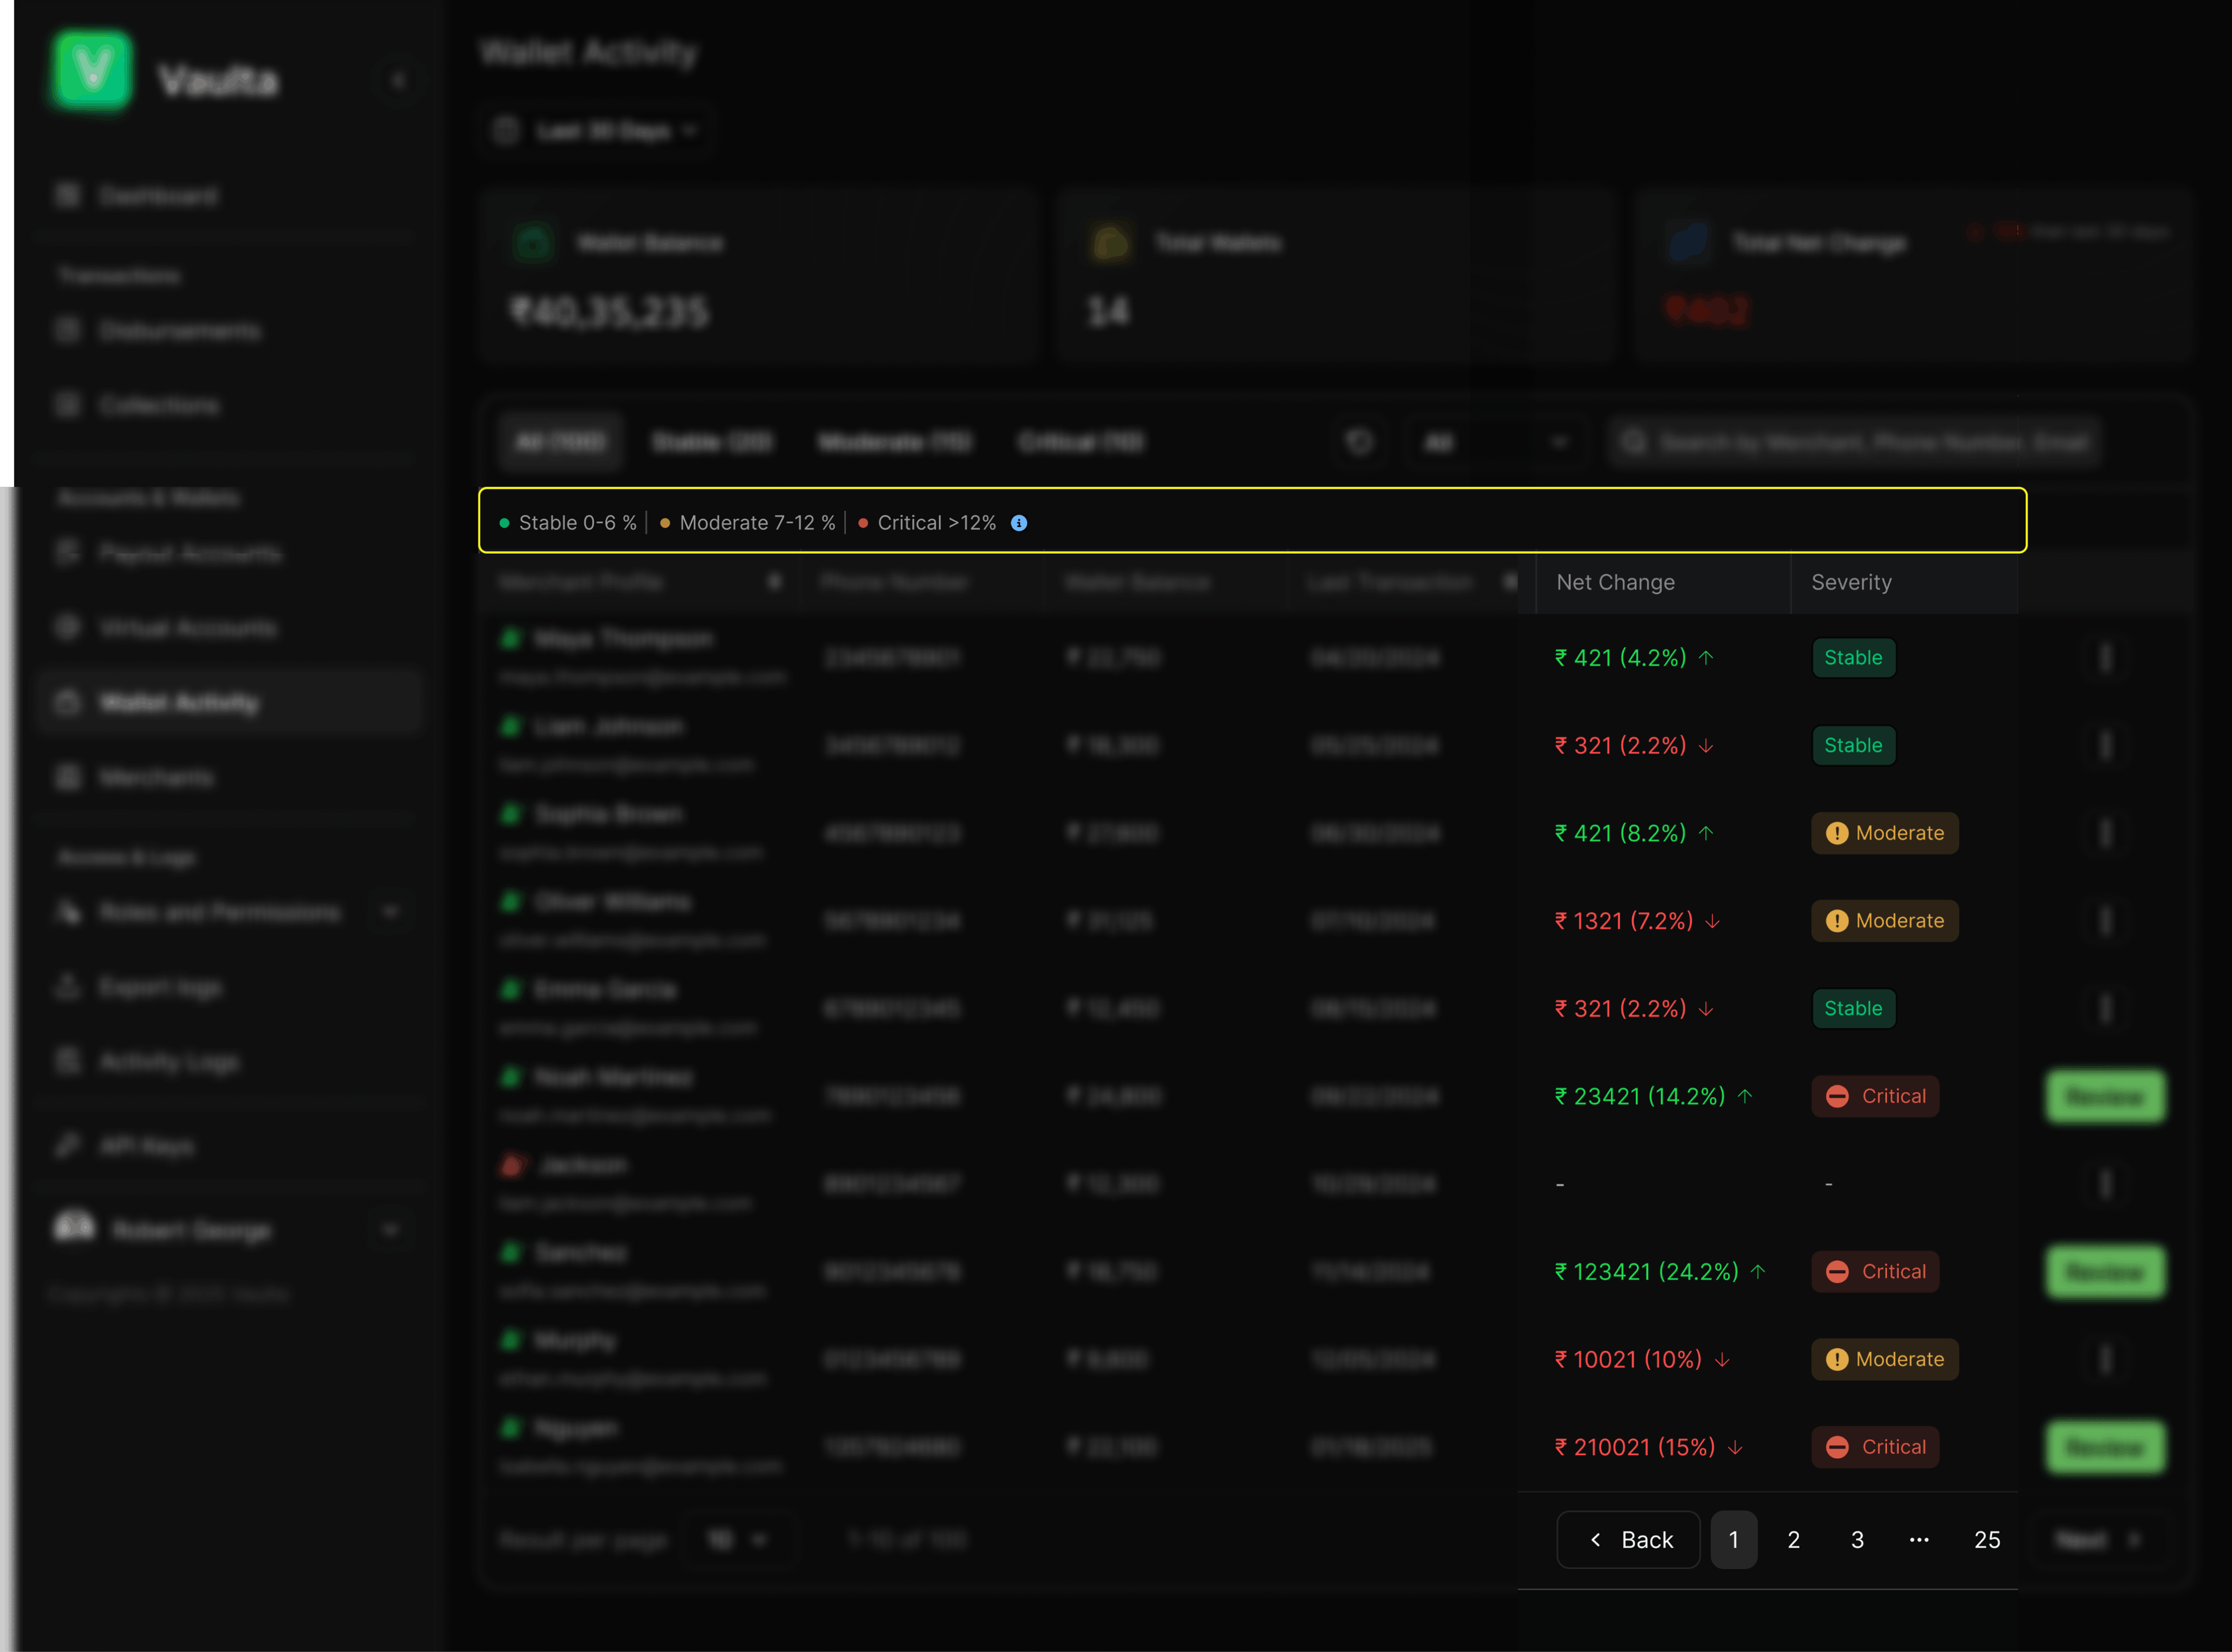
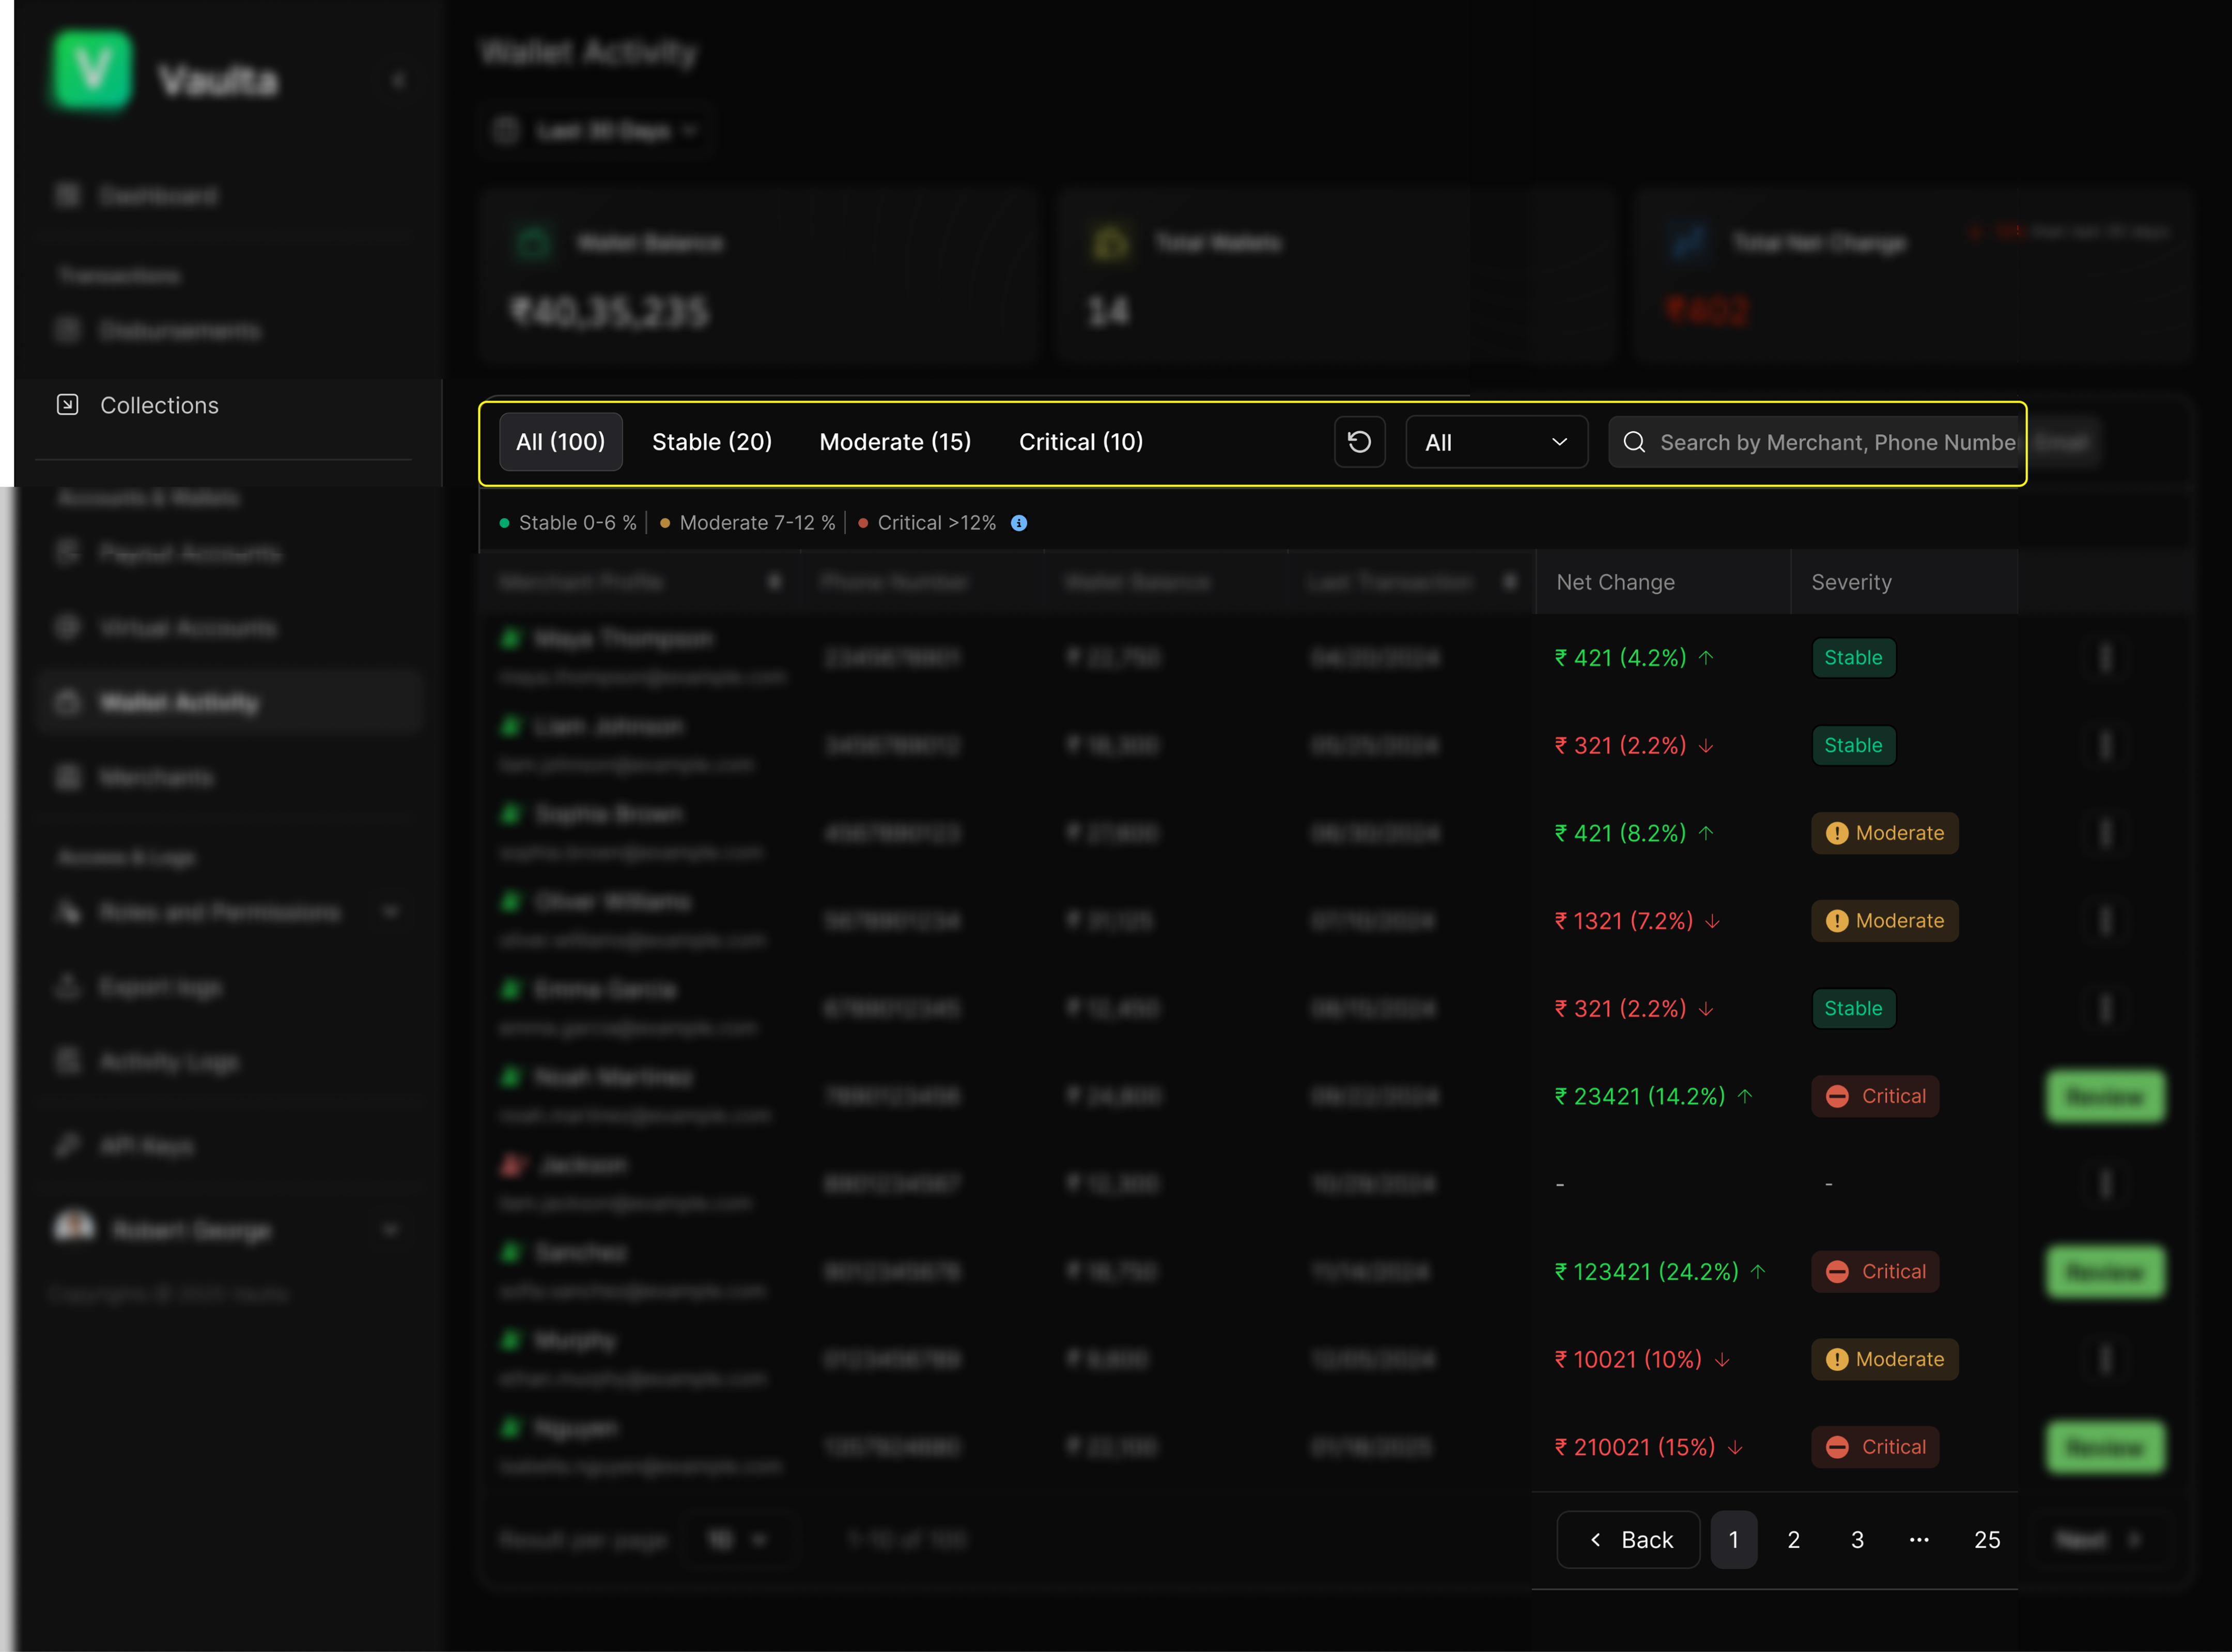
4. Guided Focus: Filters with Counts
Filters expose how many merchants fall into each risk category, helping admins decide where to focus before scanning rows.
5. Explanation Layer in Action
To bridge the gap between detection and decision-making, I designed an explanation layer that converts complex financial signals into structured, human-understandable insights.
Instead of a one-size-fits-all explanation, the system dynamically adapts based on the type of anomaly ensuring each critical case is explained with relevant context, evidence, and actions.
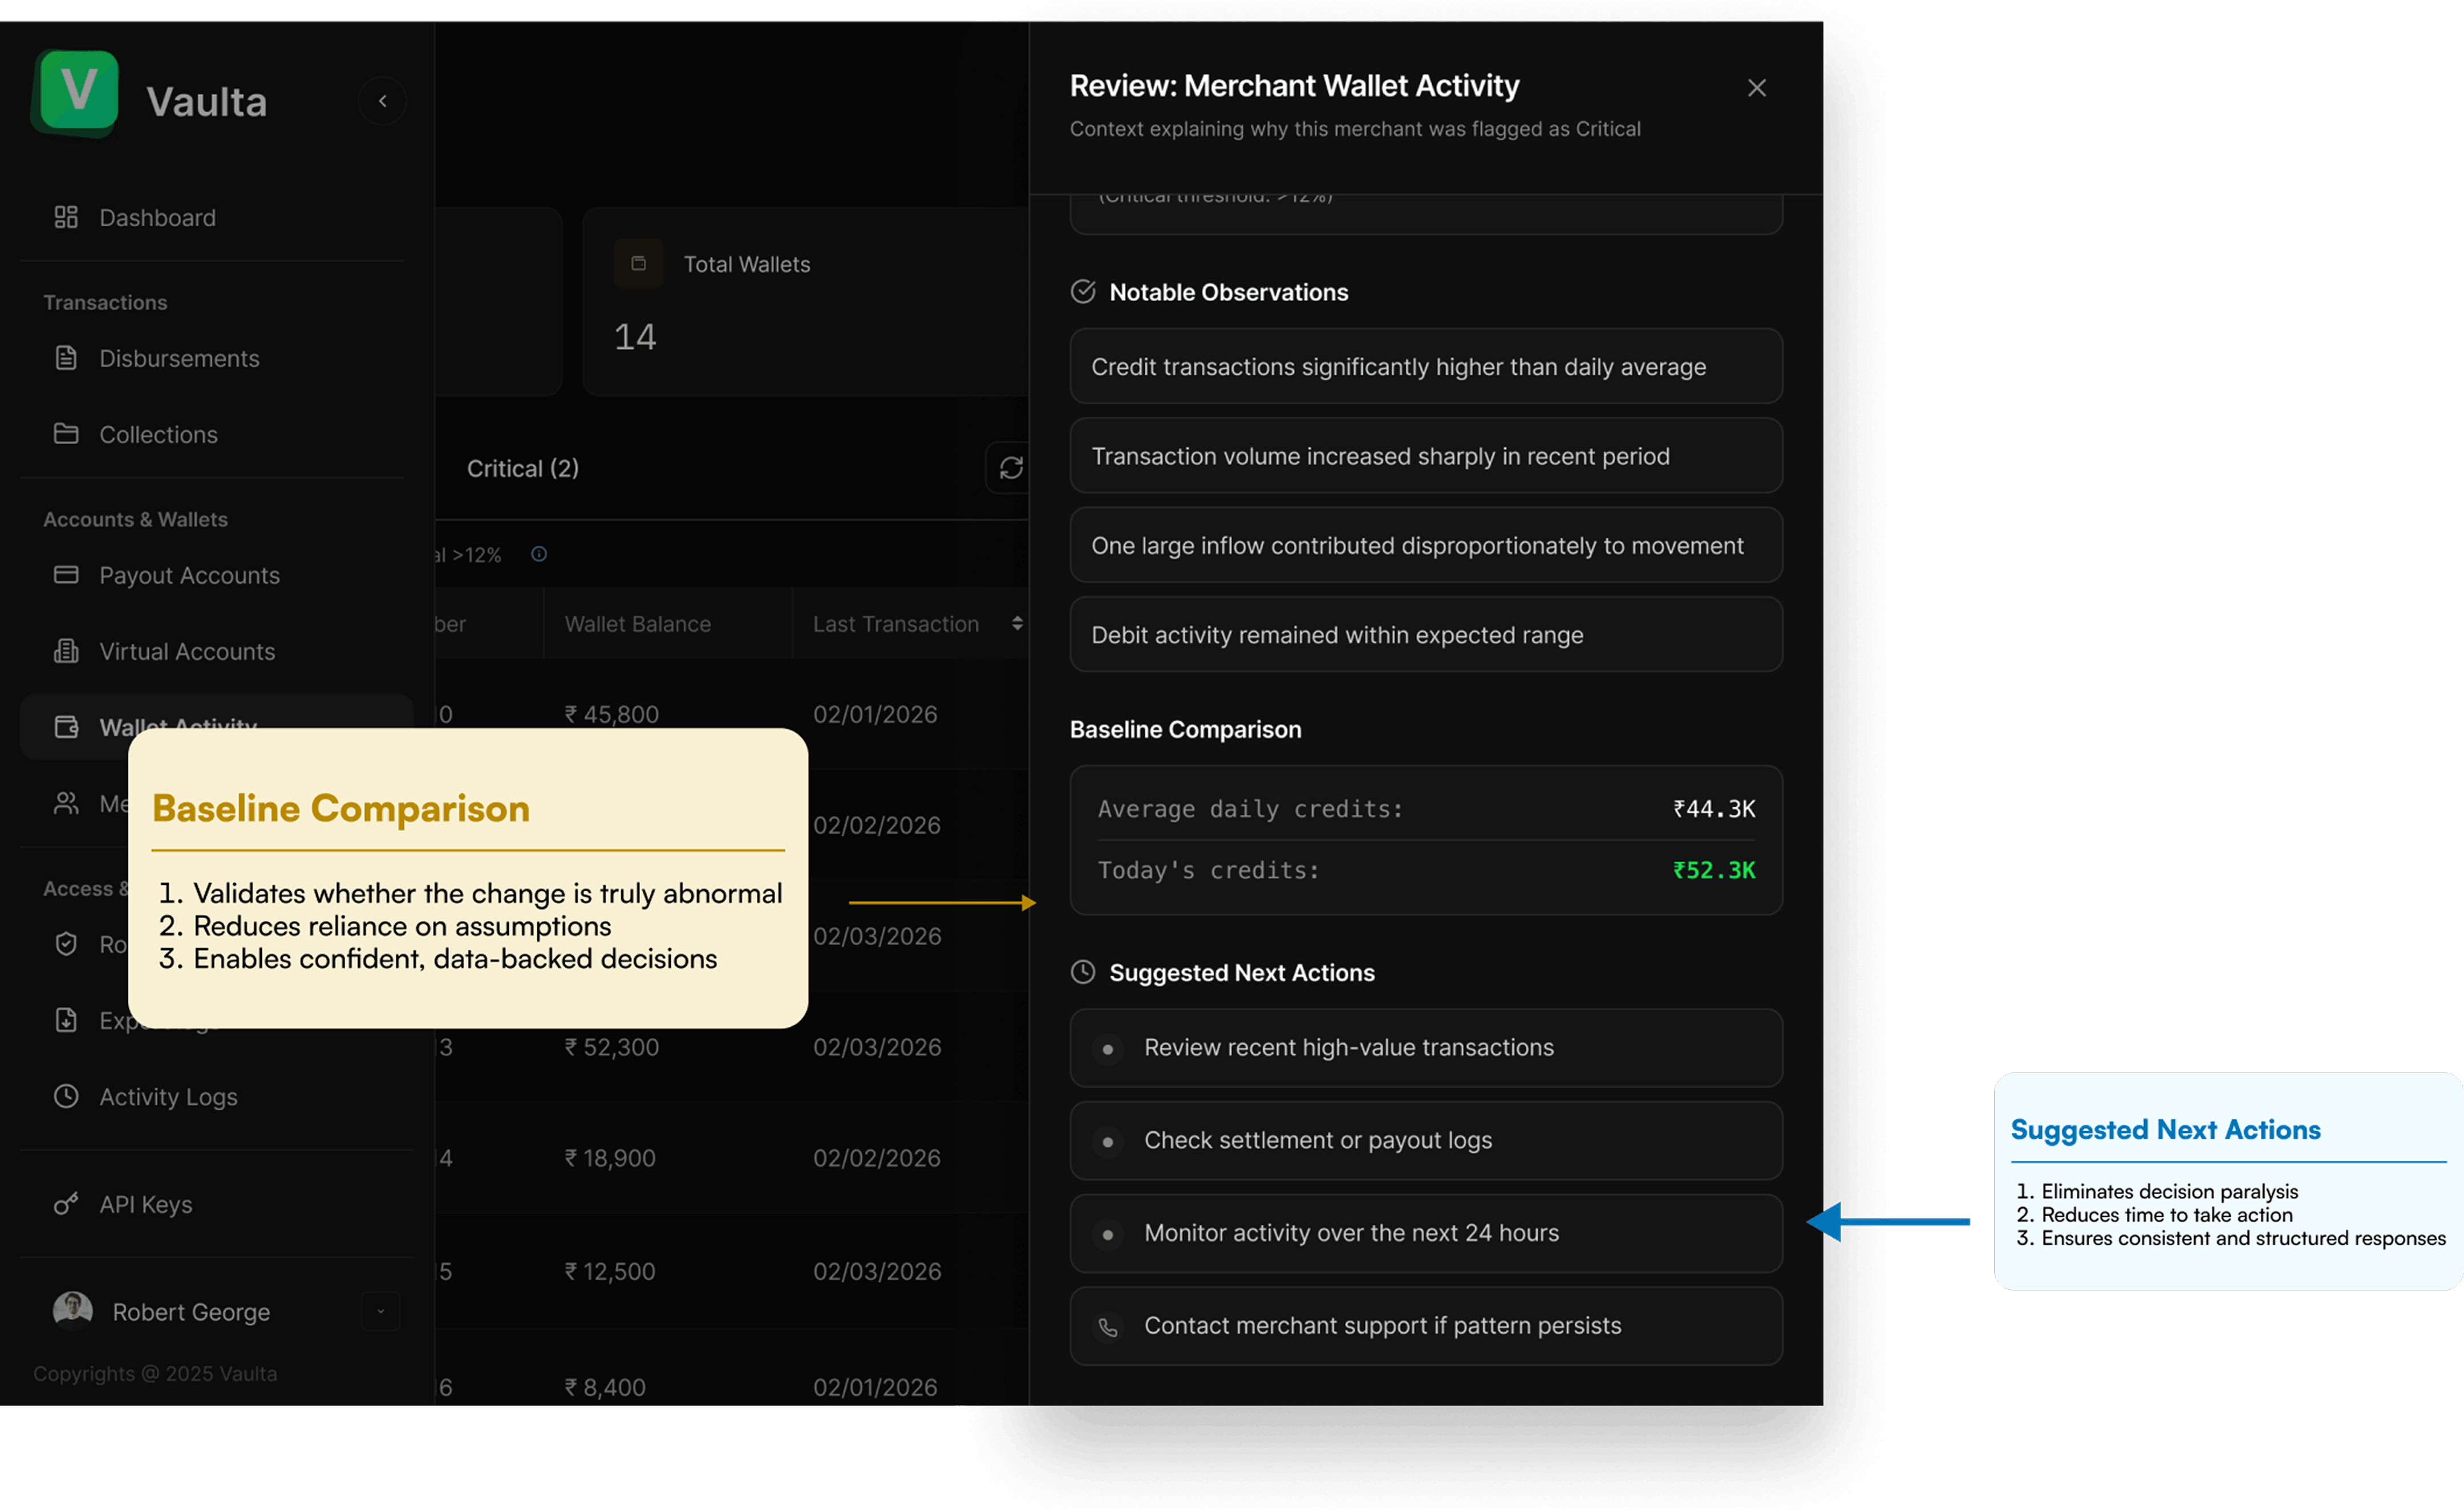
Adds context and direction by comparing current activity with historical baselines and guiding admins with clear next steps.
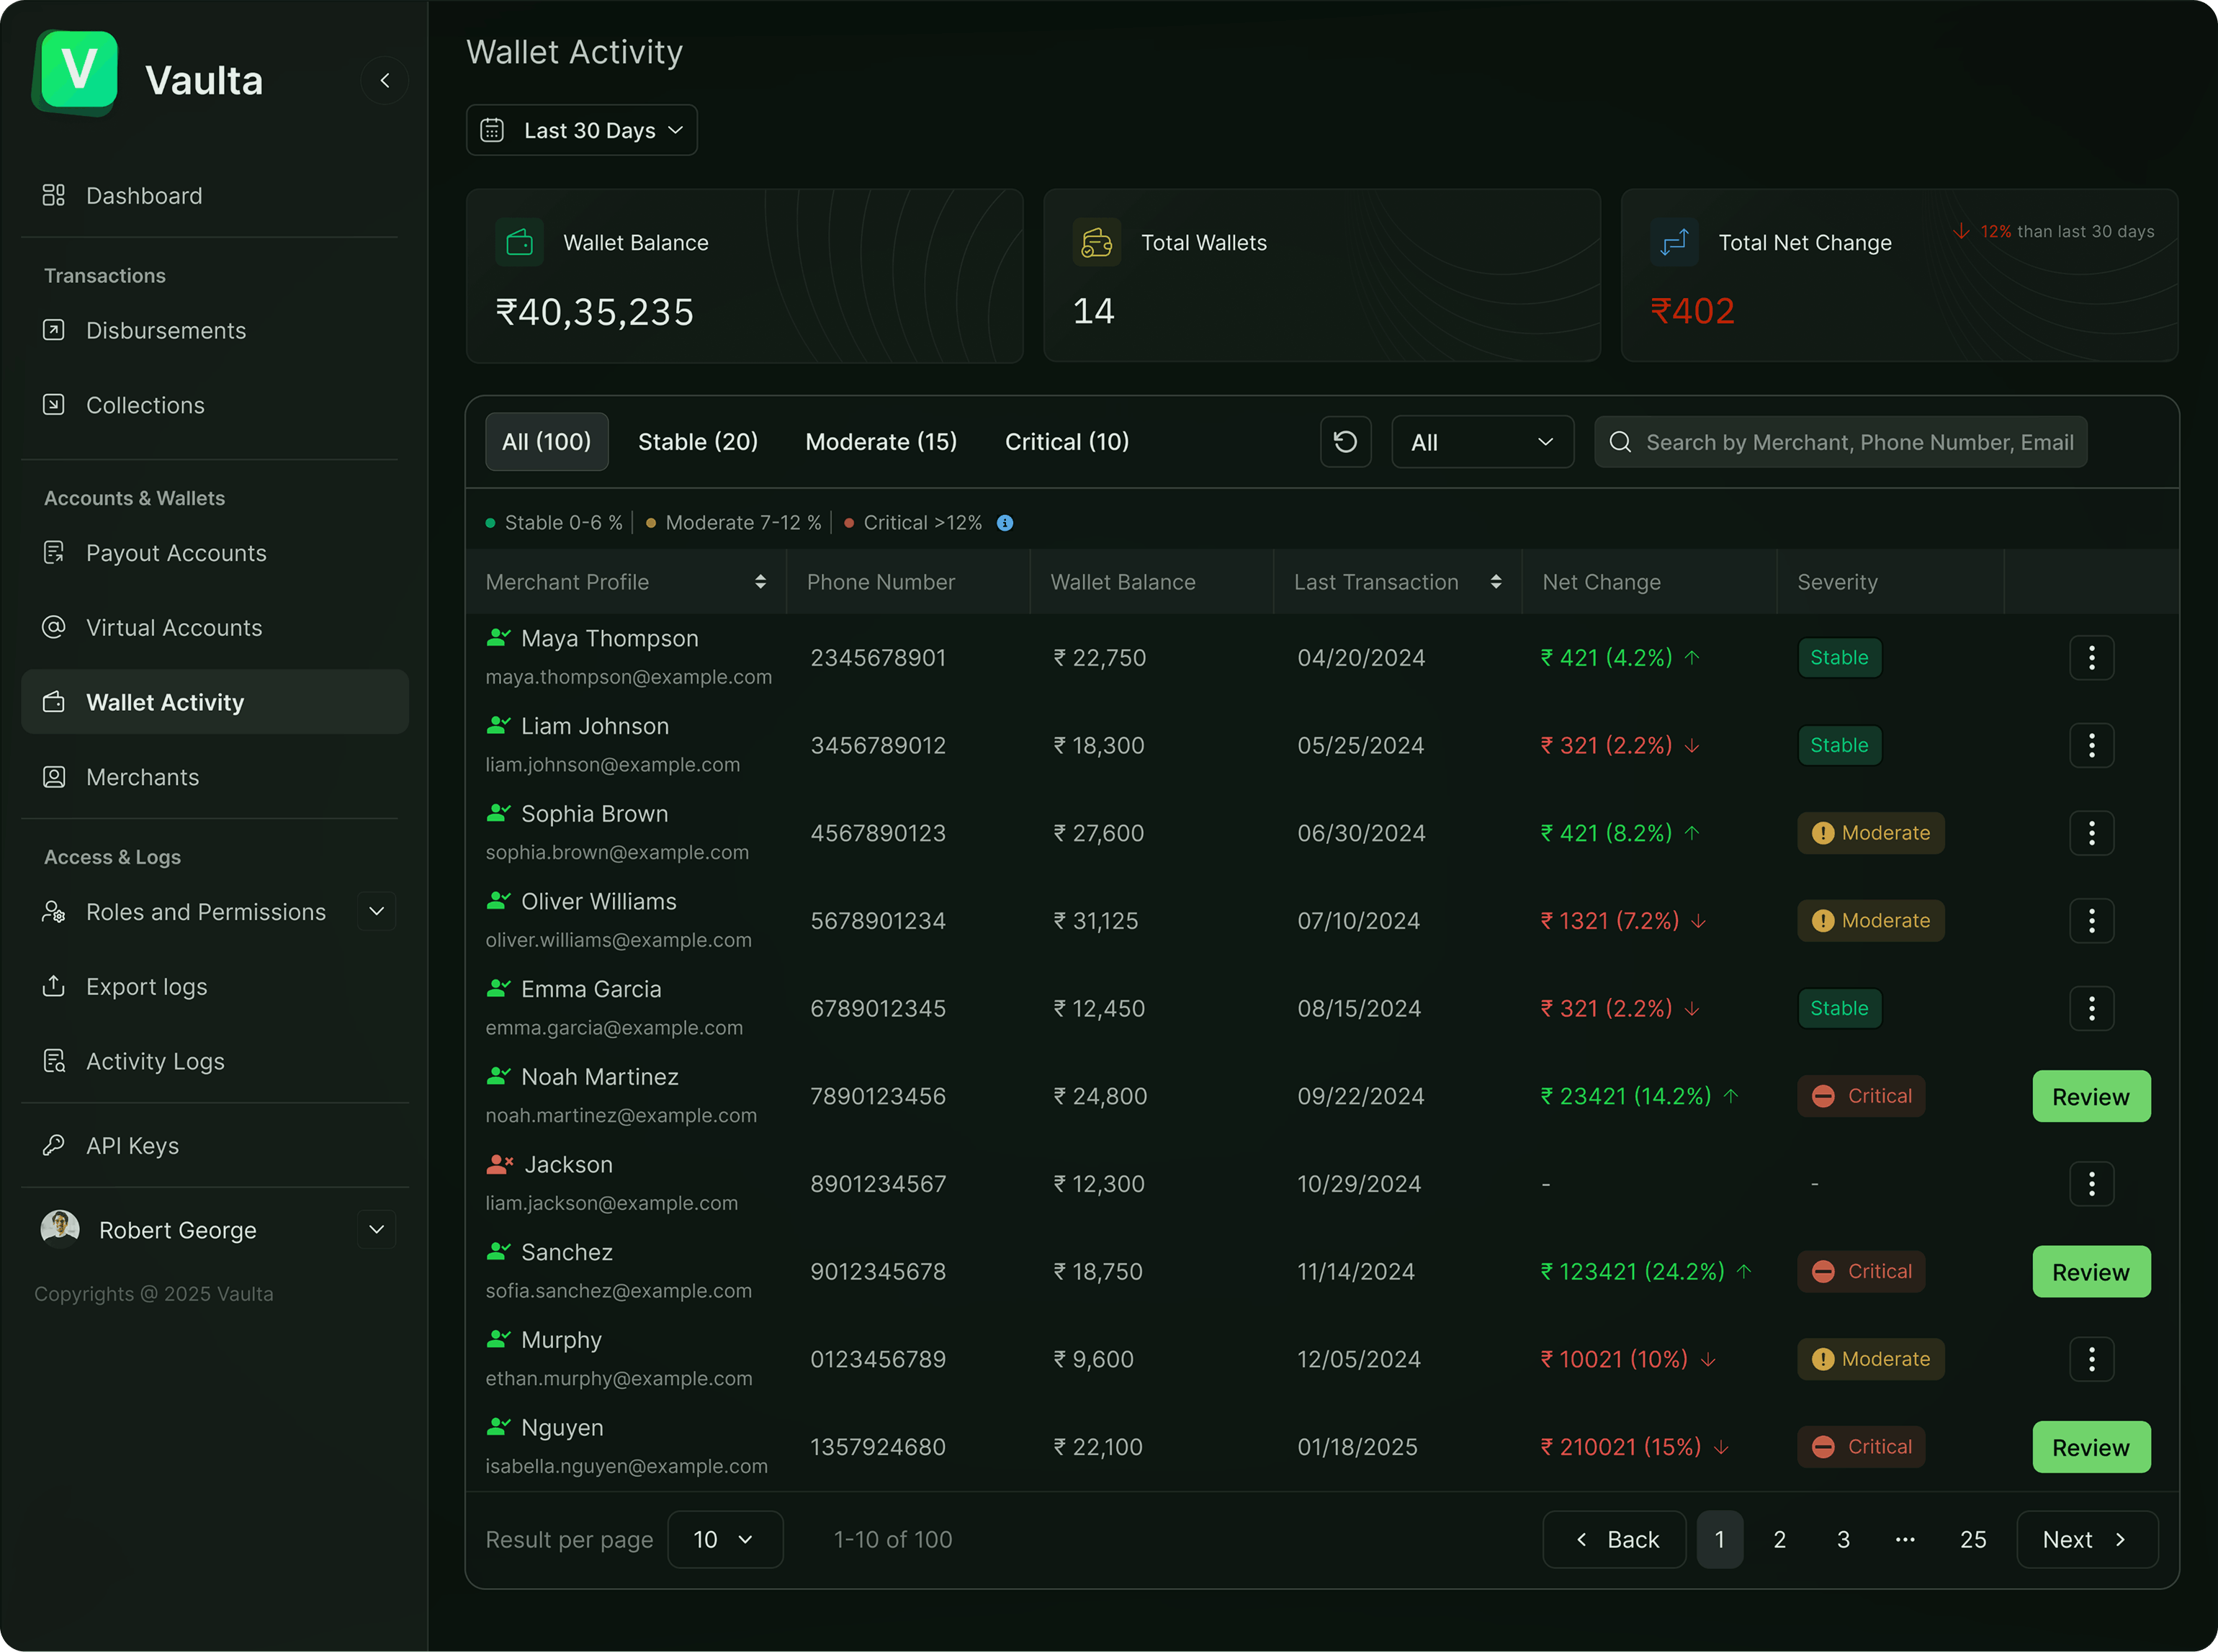
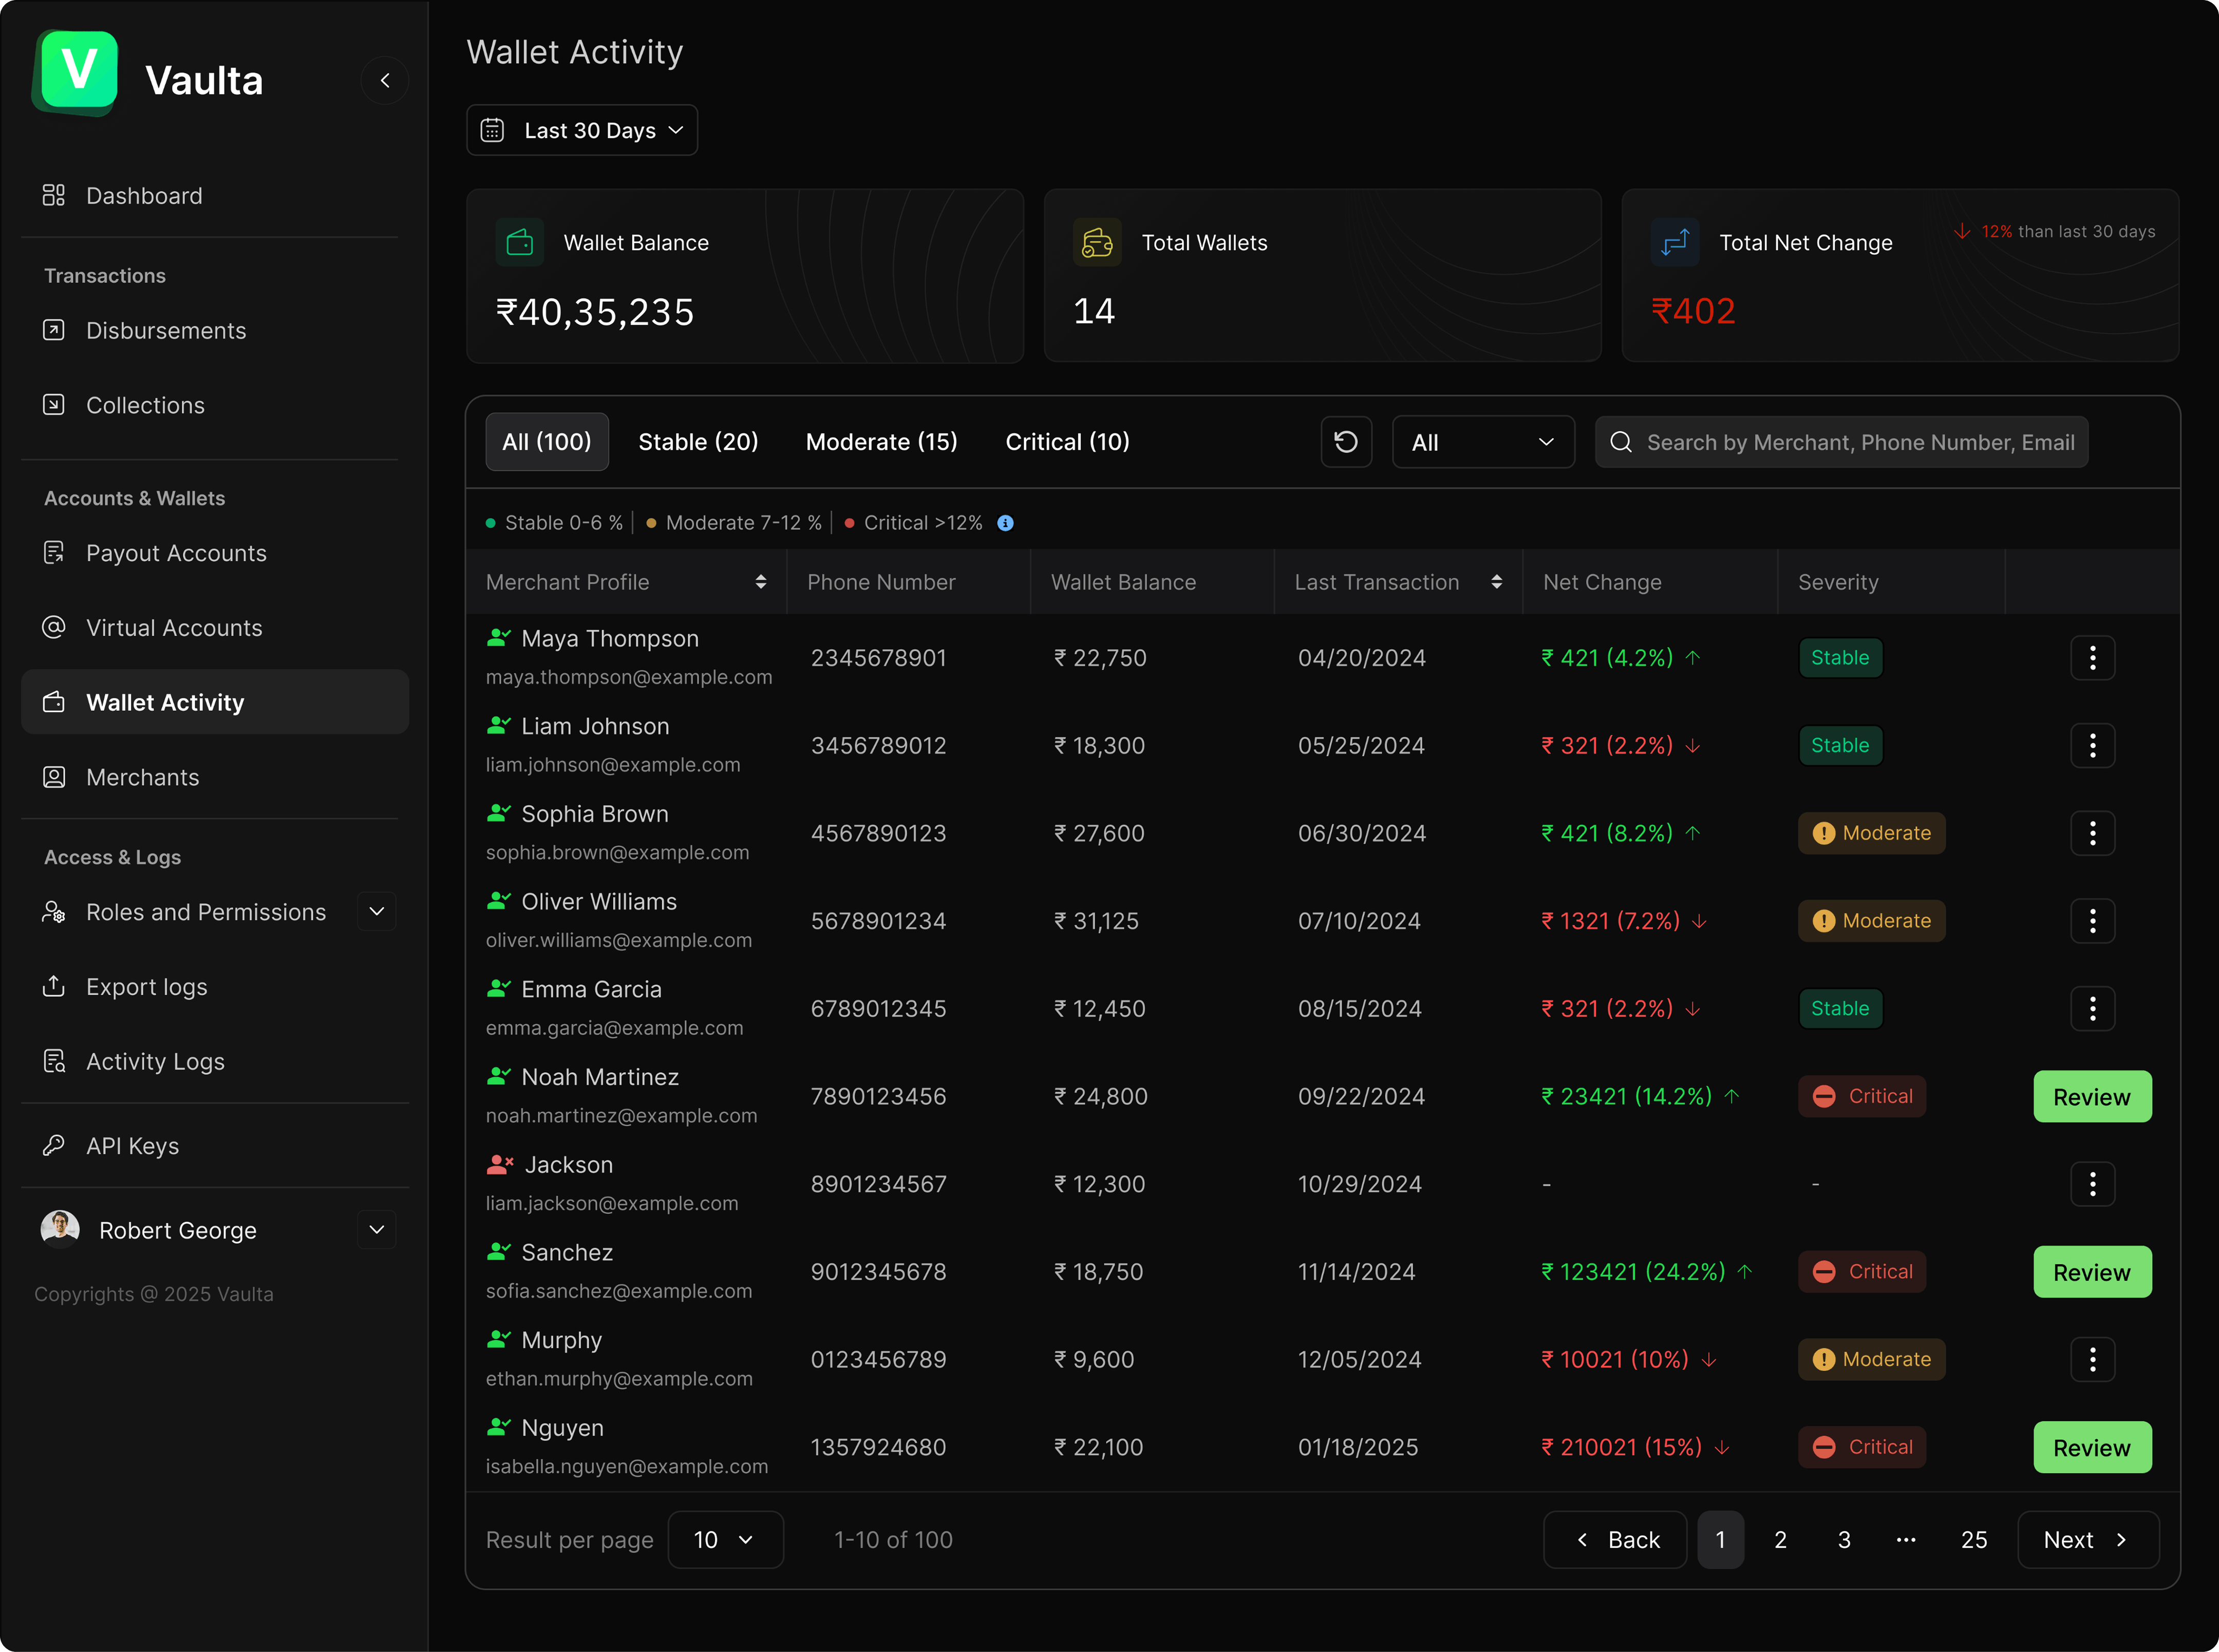
11 Final Wallet History Dashboard
This final dashboard brings together movement detection, risk interpretation, and prioritization. Admins act on decision-ready intelligence rather than raw data.
12 System Architecture (Behind the UI)
“How does this intelligence fit into the broader Nexdha system?”
The interpretation layer sits between Vaulta transaction engine and the admin interface.
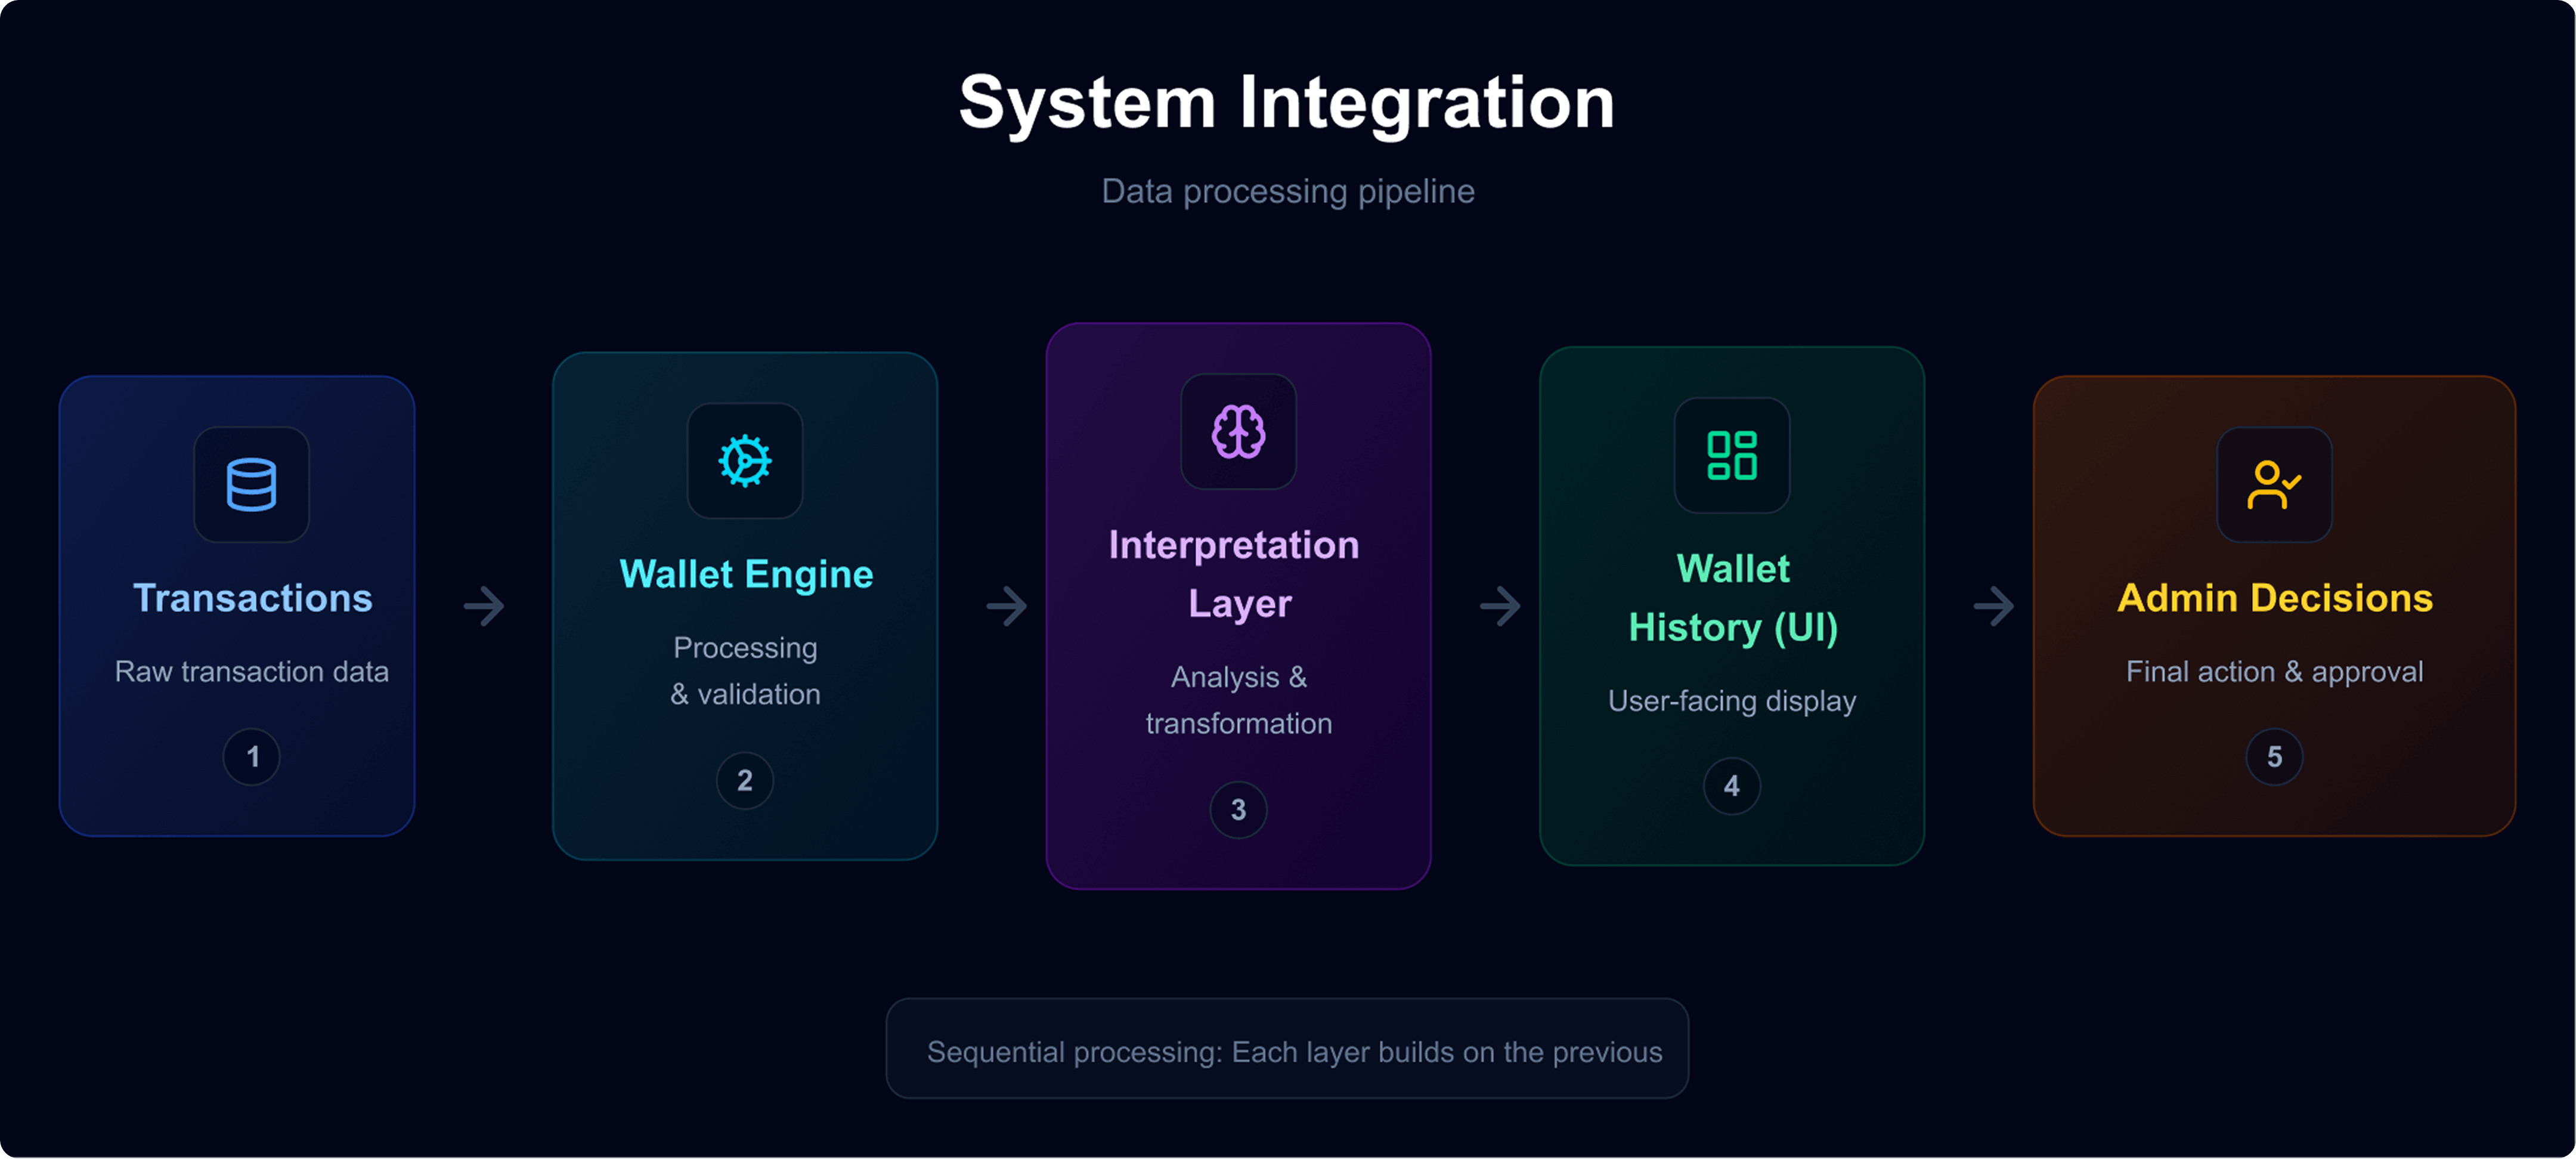
It processes wallet activity once, centrally, and outputs consistent intelligence across tables, filters, and summary metrics. This ensures that every admin view is driven by the same logic, reducing inconsistency and manual interpretation.
13 Impact
Before
- 1. Admins manually compared balances
- 2. Risk assessment relied on intuition
- 3. Monitoring required time and effort
After
- 1. The system surfaces abnormal movement automatically
- 2. Risk is Classified Consistently
- 3. Admin focus on Investigation & Action
- 4. Introduced a reusable interpretation layer
Reflection
This project was not about redesigning a table.
It was about deciding what a financial system should take responsibility for, and what it should no longer ask the user to interpret. By introducing movement, context, and explainability into the system itself, the Wallet History evolves from raw data into a source of intelligence.
“This is where product design transitions from arranging interfaces to designing systems of decision-making.”